Data Profiling
Function
Collect the serving profile data.
Precautions
Example
- Create a configuration file for profiling. The profiler collects the serving profile data based on settings in a .json file that defines whether to profile data and where to store it.
- Automatic creation: This file can be automatically created. After the SERVICE_PROF_CONFIG_PATH environment variable is configured in 2, MindIE Motor can automatically create a .json file with the default settings.
- Manual creation: This .json configuration file can be created in any directory. The following uses the ms_service_profiler_config.json file as an example. The file format is as follows:
 1
 2
 3
 4
 5
 6
 7
 8
 9
10
11
12
13
14
15
16
{
    "enable": 1,
    "prof_dir": "${PATH}",
    "profiler_level": "INFO",
    "acl_task_time": 0,
    "acl_prof_task_time_level": "",
    "aclDataTypeConfig": "",
    "aclprofAicoreMetrics": "",
    "api_filter": "",
    "kernel_filter": "",
    "timelimit": 0,
    "domain": "",
    "torch_prof_stack": false,
    "torch_prof_modules": false,
    "torch_prof_step_num": 0
}
Table 1 Parameters Parameter
Description
Required (Yes/No)
enable
Whether to enable profiling. The options are as follows:
- 0: disabled
- 1: enabled
Yes
prof_dir
Path for storing profile data. The value can be a custom character string. The default value is ${HOME}/.ms_server_profiler.
No
profiler_level
Profiling level. The value is INFO.
No
host_system_usage_freq
Frequency of profiling CPU and memory system metrics. Profiling of these metrics is disabled by default. The value is an integer ranging from 1 to 50, in Hz, indicating the number of profiling operations per second. If this parameter is set to -1, profiling of these metrics is disabled.
NOTE:Enabling this function may occupy a large amount of memory. You are advised not to modify the value.
No
npu_memory_usage_freq
Frequency of profiling NPU memory usage metrics. Profiling of these metrics is disabled by default. The value is an integer ranging from 1 to 50, in Hz, indicating the number of profiling operations per second. If this parameter is set to -1, profiling of these metrics is disabled.
NOTE:Enabling this function may occupy a large amount of memory. You are advised not to modify the value.
No
acl_task_time
Whether to enable profiling for operator delivery and execution durations. The options are as follows:
- 0: disabled It is the default value. If this parameter is set to 0 or an invalid value, this function is disabled.
- 1: enabled
If this function is enabled, the ACL_PROF_TASK_TIME_L0 parameter of the aclprofCreateConfig API is called.
- 2: msPTI-based data flushing is enabled.
If this function is enabled, the msPTI APIs are called to profile data. You need to configure the following environment variable before starting the service:
export LD_PRELOAD=${INSTALL_DIR}/lib64/libmspti.soReplace ${INSTALL_DIR} with the CANN component directory. For example, if the installation is performed by the root user, the default file storage path is /usr/local/Ascend/cann.
- 3: Torch Profiler-based data flushing is enabled.
No
acl_prof_task_time_level
Profiling level and duration. The options are as follows:
- L0: level 0, indicating that the operator delivery and operator execution durations will be profiled. Compared with L1, L0 does not profile basic operator information, so the profiling overhead is smaller and the profiled duration data is more accurate. It is equivalent to ACL_PROF_MSPROFTX and ACL_PROF_TASK_TIME_L0 in aclDataTypeConfig.
- L1: level 1, indicating that AscendCL APIs will be profiled, including the synchronous/asynchronous memory copy latencies between the host and devices and between devices, operator delivery and execution durations, and basic operator information. This provides more comprehensive profile data. It is equivalent to ACL_PROF_MSPROFTX, ACL_PROF_TASK_TIME, and ACL_PROF_ACL_API in aclDataTypeConfig.
- <time>: profiling duration, which is a positive integer ranging from 1 to 999, in seconds.
By default, this parameter is not set, indicating that L0 data is profiled until the program execution is complete. If other invalid values are set, the default value is used.
The profiling level and duration can be configured at the same time, for example, "acl_prof_task_time_level": "L1;10".
No
aclDataTypeConfig
Profile data type. You can select one or more of the following macros for logic OR. Each macro indicates a type of profile data. The options are as follows:
For details about the results of the following profiling items, see Profiling Description. The actual results may vary.
You can configure one or more of the following profiling items at a time, for example, "aclDataTypeConfig": "ACL_PROF_ACL_API" or "aclDataTypeConfig": "ACL_PROF_ACL_API, ACL_PROF_TASK_TIME".
- ACL_PROF_ACL_API: collects profile data of APIs, including the synchronous/asynchronous memory copy latencies between the host and devices and between devices.
- ACL_PROF_TASK_TIME: collects operator delivery and execution duration data, as well as basic operator information, to provide more comprehensive profile data.
- ACL_PROF_TASK_TIME_L0: collects operator delivery and execution duration data. Compared with ACL_PROF_TASK_TIME, this option does not profile basic operator information, so the profiling overhead is smaller and the profiled duration data is more accurate.
- ACL_PROF_OP_ATTR: profiles operator attribute information. Currently, only the aclnn operator is supported.
- ACL_PROF_AICORE_METRICS: collects AI Core metrics. This macro must be included in the logic OR for aicoreMetrics to take effect.
- ACL_PROF_TASK_MEMORY: controls the switch for profiling the memory usage of CANN operators, which is used to optimize the memory usage. In the single-operator scenario, the operator memory size and lifecycle information is collected based on GE component and operator dimensions (the GE component memory is not collected in the single-operator API execution mode). In the static graph and static subgraph scenarios, the operator memory size and lifecycle information is collected based on operator dimension during the operator compilation phase.
- ACL_PROF_AICPU: profiles the start and end data of AI CPU tasks.
- ACL_PROF_L2CACHE: profiles L2 cache data.
- ACL_PROF_HCCL_TRACE: profiles communication data.
- ACL_PROF_TRAINING_TRACE: profiles iteration traces.
- ACL_PROF_RUNTIME_API: profiles runtime API data.
- ACL_PROF_MSPROFTX: collects the profile data output by the user and upper-layer framework applications. You can call either of the following APIs in the profiling process (between the aclprofStart and aclprofStop calls) to record the time span of specific events during application execution, write the profile data file, use the msprof tool to parse the file, and export and display the profile data:
- mstx APIs (MindStudio Tools Extension APIs). For details, see mstx API Use Case.
- msproftx APIs. For details, see Profiling Data Collection.
By default, this parameter is not set, and the system defaults to "acl_prof_task_time_level": "L0".
No
aclprofAicoreMetrics
AI Core metrics to profile. The options are as follows:
For details about the results of the following profiling items, see op_summary (Operator Details). The actual results may vary.
Only one of the following profiling items can be configured at a time, for example, "aclprofAicoreMetrics": "ACL_AICORE_PIPE_UTILIZATION".
- ACL_AICORE_PIPE_UTILIZATION: percentages of time taken by compute units and MTEs.
- ACL_AICORE_MEMORY_BANDWIDTH: percentage of external memory read/write instructions.
- ACL_AICORE_L0B_AND_WIDTH: percentage of internal memory read/write instructions.
- ACL_AICORE_RESOURCE_CONFLICT_RATIO: percentage of pipeline queue instructions.
- ACL_AICORE_MEMORY_UB: percentage of internal memory read/write instructions.
- ACL_AICORE_L2_CACHE: cache re-allocations upon missing of the read/write cache hit count.
- ACL_AICORE_NONE = 0xFF
The default value is ACL_AICORE_PIPE_UTILIZATION.
The configuration of this API takes effect only when aclDataTypeConfig is set to ACL_PROF_AICORE_METRICS.
No
api_filter
Profile data filtering. You can customize the API profile data to be collected. For example, if matmul is passed, the profile data of all APIs whose name contains matmul is flushed to the drive. The value is of the string type and is case sensitive. Multiple filter criteria must be separated by semicolons (;). By default, this parameter is left blank, indicating that all data is flushed to the drive.
This parameter is valid only when acl_task_time is set to 2.
No
kernel_filter
Profile data filtering. You can customize the kernel profile data to be collected. For example, if matmul is passed, the profile data of all kernels whose name contains matmul is flushed to the drive. The value is of the string type and is case sensitive. Multiple filter criteria must be separated by semicolons (;). By default, this parameter is left blank, indicating that all data is flushed to the drive.
This parameter is valid only when acl_task_time is set to 2.
No
timelimit
Profiling duration. After this parameter is set, the profiling process automatically stops after the specified duration. The value is an integer ranging from 0 to 7200, in seconds. The default value is 0, indicating that the profiling duration is not limited.
NOTE:You are advised to set the profiling duration to at least 120s. If the profiling duration is too short, the data may not meet the requirements for generating the parsing output. In this case, an alarm is printed.
No
domain
Domain to profile. Specifying domains help reduce the amount of data to profile. The input parameter is a string of case-sensitive characters separated by semicolons (;), for example, "Request; KVCache".
By default, this parameter is left blank, indicating that all domains will be profiled.
The existing domains are Request, KVCache, ModelExecute, BatchSchedule, Communication, and eplb_observe.
If the eplb_observe domain is configured and MINDIE_ENABLE_EXPERT_HOTPOT_GATHER and MINDIE_EXPERT_HOTPOT_DUMP_PATH are enabled, the profile data contains expert hotspot information. The parsing results are used to generate an expert hotspot information heatmap. You are advised to enable the eplb_observe domain separately if expert hotspot information needs to be profiled.
NOTE:An alarm will be triggered if incomplete domain configurations result in insufficient data for parsing and generating output files. For details, see Table 1.
No
torch_prof_stack
Operator call stack, including the call information at the framework layer and CPU operator layer. Possible values are as follows:
- false (default): disabled
- true: enabled
NOTE:- Before enabling this function, set acl_task_time to 3.
- Enabling this configuration will cause extra performance overhead.
No
torch_prof_modules
Python call stack at the modules layer, which is the call information at the framework layer. Possible values are as follows:
- false (default): disabled
- true: enabled
NOTE:- Before enabling this function, set acl_task_time to 3.
- Enabling this configuration will cause extra performance overhead.
No
torch_prof_step_num
Number of steps for profiling. The value is an integer greater than or equal to 0. The default value is 0, indicating that all steps are profiled.
NOTE:Before enabling this function, set acl_task_time to 3.
No
- Perform profiling.
- Configure the environment variable to specify the profiling configuration file ms_service_profiler_config.json.
export SERVICE_PROF_CONFIG_PATH="./ms_service_profiler_config.json"
- If the .json configuration file does not exist in the path configured for the environment variable, a .json file with default configurations is automatically created in the path and enable is set to 0. You need to perform 2.c after running MindIE Motor and set enable to 1 to enable the profiling task.
- If a .json file with the same name already exists in the path configured for the environment variable, no .json file will be created.
- Run MindIE Motor.
- Enable the profiling task.
Open another CLI window and modify the enable field in the ms_service_profiler_config.json configuration file to enable or disable profiling in real time. Logs are generated when profiling is enabled or disabled, see 1 for details.
After the profiling is complete, the profile data is flushed to the path specified by the prof_dir parameter in the ms_service_profiler_config.json file.

You can use the Samba tool to share the configuration file for profiling across multiple nodes and ranks. In multi-node and multi-rank setups, follow the same profiling steps mentioned earlier but launch MindIE Motor on every node. Samba is a third-party tool. Search for its usage guide online or try alternative tools for configuring shared directories.
The profiler supports dynamic start and stop when the service is running. The dynamic start and stop function allows you to start or stop profiling whenever needed.
There are three main scenarios as follows:
- Enabling the function: Set the enable field in the .json configuration file to 0 before starting MindIE Motor. Change enable to 1 once the service is running. The log prints a message indicating that the profiling function is enabled.
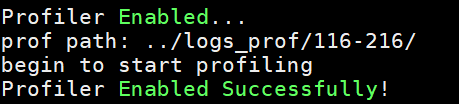
- Disabling the function: Set the enable field in the .json configuration file to 1 before starting MindIE Motor. Change enable to 0 once the service is running. The log prints a message indicating that the profiling function is disabled.

- The .json configuration file is updated but the enable field remains unchanged. In this case, the profiling function status remains unchanged and the log prints the following message.

- Configure the environment variable to specify the profiling configuration file ms_service_profiler_config.json.
Output Description
Logs are printed during profiling to indicate the status of the profiling process. You can configure the PROF_LOG_LEVEL environment variable to control the log printing as follows:
The PROF_LOG_LEVEL environment variable is used to configure the profiling log level. The following is an example:
export PROF_LOG_LEVEL=INFO
The log level can be set as follows (the default level is INFO):
- INFO: information such as whether to enable profiling and the data flush path.
Example:
1
2
3
[msservice_profiler] [PID:52856] [INFO] [ReadEnable:306] profile enable_: true
[msservice_profiler] [PID:52856] [INFO] [ReadAclTaskTime:335] profile enableAclTaskTime_: false
[msservice_profiler] [PID:52856] [INFO] [StartProfiler:661] prof path: ./log/0423-0852/
- DEBUG: detailed log information, including the configuration file path, and whether to enable NPU and CPU profiling.
Example:
1
2
3
4
[msservice_profiler] [PID:82231] [DEBUG] [ReadConfig:275] SERVICE_PROF_CONFIG_PATH : prof.json
[msservice_profiler] [PID:82231] [DEBUG] [ReadLevel:386] profiler_level: 20
[msservice_profiler] [PID:82231] [DEBUG] [ReadHostConfig:510] host_system_usage_freq Disabled
[msservice_profiler] [PID:82231] [DEBUG] [ReadNpuConfig:541] npu_memory_usage_freq Disabled
- WARNING: warnings about incorrect parameter settings and dynamic library loading failures.
1
2
3
4
[msservice_profiler] [PID:43982] [WARNING] [ReadEnable:323] enable value is not an integer, will set false.
[msservice_profiler] [PID:43984] [WARNING] [ReadEnable:323] enable value is not an integer, will set false.
[msservice_profiler] [PID:43993] [WARNING] [ReadEnable:323] enable value is not an integer, will set false.
[msservice_profiler] [PID:44002] [WARNING] [ReadEnable:323] enable value is not an integer, will set false.
- ERROR: errors.
Example:
1[msservice_profiler] [PID:87888] [ERROR] [StartProfiler:677] create path(./log/0423-1007/) failed