Parsing Results
The results of ms_service_profiler.parse are as follows:
|
Parsing Result File |
Domain |
|---|---|
|
profiler.db |
"Schedule" |
|
chrome_tracing.json |
No mandatory restriction. To view flow events between requests, you must profile the Request domain. |
|
batch.csv |
"Schedule" |
|
kvcache.csv |
"KVCache" |
|
request.csv |
"Request" |
|
forward.csv |
"Schedule" |
|
pd_split_communication.csv |
"Communication" |
|
pd_split_kvcache.csv |
"KVCache" |
|
coordinator.csv |
"Coordinator" |
|
{host_name}_eplb_{i}_summed_hot_map_by_expert.png |
"eplb_observe" |
|
{host_name}_eplb_{i}_summed_hot_map_by_rank.png |
"eplb_observe" |
|
{host_name}_eplb_{i}_summed_hot_map_by_model_expert.png |
"eplb_observe" |
|
{host_name}_balance_ratio.png |
"eplb_observe" |

The parsing results of the acl_prof_task_time_level, aclDataTypeConfig, and aclprofAicoreMetrics parameters are not listed in the preceding table. For details about the parsing results of the three parameters, see Profiling Description and op_summary (Operator Details). The actual results may vary. The op_statistic_*.csv and op_summary_*.csv files are flushed to the PROF_XXX directory in the directory specified by --output-path. The profile data files collected using the three parameters are saved in the PROF_XXX/mindstudio_profiler_output directory under the directory specified by prof_dir.
The files are as follows:
profiler.db
SQLite database file used to generate line charts.
It contains the following database tables. The following table describes the functions of the tables:
|
Table Name |
Meaning |
|---|---|
|
batch |
Displays batch table data on MindStudio Insight. |
|
decode_gen_speed |
Generates line charts showing average token latency at different time points in the decode phase. |
|
first_token_latency |
Generates line charts showing the time to first token (TTFT) of the serving framework. |
|
kvcache |
Generates line charts showing the serving KV cache memory usage. |
|
prefill_gen_speed |
Generates line charts showing average token latency at different time points in the prefill phase. |
|
req_latency |
Generates line charts showing the end-to-end request latency of the serving framework. |
|
request_status |
Generates line charts showing the request status of the serving profile data at different time points. |
|
request |
Displays request table data on MindStudio Insight. |
|
batch_exec |
Displays the mapping between batches and model execution. |
|
batch_req |
Displays the mapping between batches and requests. |
|
data_table |
Displays table data on MindStudio Insight. |
|
counter |
Displays counter data in the trace view. |
|
flow |
Displays flow data in the trace view. |
|
process |
Displays secondary lane data in the trace view. |
|
thread |
Displays tertiary lane data in the trace view. |
|
slice |
Displays slice data in the trace view. |
|
pd_split_kvcache |
Displays KV cache table data of the decode node on MindStudio Insight, exclusive to prefill-decode (PD) disaggregation scenarios. |
|
pd_split_communication |
Displays communication table data between prefill and decode nodes on MindStudio Insight, exclusive to PD disaggregation scenarios. |
|
ep_balance |
Records load imbalance analysis results for the GroupedMatmul operator, profiled via msPTI during DeepSeek MoE inference serving. |
|
moe_analysis |
Records fast/slow rank analysis results for the MoeDistributeCombine and MoeDistributeDispatch operators, profiled via msPTI during DeepSeek MoE inference serving. |
|
data_link |
Enables drill-down on rid in the trace view to view request input length during the forward. |
For details about PD disaggregation and related concepts, see Cluster Service Deployment > Prefill-Decode Disaggregation in the MindIE Motor Development Guide.
This file is intended for visualizing data in Grafana. Details about each entry are not described.
chrome_tracing.json
Records trace data of inference serving requests. You can visualize this data using various tools. Refer to Data Visualization for more information.
batch.csv
Records detailed batch-level data for inference serving.
|
Field |
Description |
|---|---|
|
name |
Distinguishes batching from batch execution. batchFrameworkProcessing refers to batching, while modelExec refers to batch execution. |
|
res_list |
Lists the batches. |
|
start_time |
Indicates the start time of batching or batch execution. |
|
end_time |
Indicates the end time of batching or execution. |
|
batch_type |
Indicates the request status (prefill or decode) in a batch. |
|
during_time(ms) |
Indicates the execution time, in ms. |
|
prof_id |
Identifies a card. This value is the same for the same device. |
|
total_batch_size |
Records the total batch size during the batching. |
|
total_blocks |
Records the total number of KV cache memory blocks, obtained from the original TotalBlocks field. |
|
used_blocks |
Records the number of memory blocks actually occupied after scheduling. The formula is as follows: total_blocks – free_blocks. |
|
free_blocks |
Records the number of available memory blocks remaining after scheduling, obtained from the original FreeBlocksAfter field. |
|
blocks_allocated |
Records the KV cache resources consumed by this scheduling operation. The formula is as follows: FreeBlocksBefore – FreeBlocksAfter. |
|
blocks_freed |
Records the KV cache resources released from this scheduling operation. The formula is as follows: FreeBlocksAfter – FreeBlocksBefore. |
|
kvcache_usage_rate |
Calculates the percentage of the KV cache memory usage during scheduling. The formula is as follows: used_blocks/total_blocks. |
|
prefill_batch_size |
Records the batch size in the prefill phase of the scheduling. |
|
decode_batch_size |
Records the batch size in the decode phase of the scheduling. |
|
prefill_scheduled_tokens |
Records the number of tokens occupied by prefill during scheduling |
|
decode_scheduled_tokens |
Records the number of tokens occupied by decode during scheduling. |
|
total_scheduled_tokens |
Records the total number of tokens during scheduling. |
|
dp_rank |
Marks the DP information of a batch. This value is the same for the same DP domain. |
kvcache.csv
Records device memory usage during inference.
|
Field |
Description |
|---|---|
|
domain |
Marks the KV cache event. |
|
name |
Indicates the method of changing the device memory usage. |
|
start_time |
Indicates the time when the device memory usage changes. |
|
total_blocks |
Records the total number of KV cache memory blocks, obtained from the original TotalBlocks field. |
|
used_blocks |
Records the number of memory blocks actually occupied after scheduling. The formula is as follows: total_blocks – free_blocks. |
|
free_blocks |
Records the number of available memory blocks remaining after scheduling, obtained from the original FreeBlocksAfter field. |
|
blocks_allocated |
Records the KV cache resources consumed by this scheduling operation. The formula is as follows: FreeBlocksBefore – FreeBlocksAfter. |
|
blocks_freed |
Records the KV cache resources released from this scheduling operation. The formula is as follows: FreeBlocksAfter – FreeBlocksBefore. |
|
kvcache_usage_rate |
Calculates the percentage of the KV cache memory usage during scheduling. The formula is as follows: used_blocks/total_blocks. |
request.csv
Records detailed request-level data for inference serving.
|
Field |
Description |
|---|---|
|
http_rid |
HTTP request ID. |
|
start_datetime |
Time when a request arrives. |
|
recv_token_size |
Input token length of a request. |
|
reply_token_size |
Output token length of a request. |
|
execution_time(ms) |
End-to-end request duration, in ms. |
|
queue_wait_time(ms) |
Time for a request to wait in the queue throughout the entire inference process, including the time in the waiting and pending states, in ms. |
|
first_token_latency(ms) |
Time to first token (TTFT), in ms. |
|
cache_hit_rate |
Cache hit rate. |
forward.csv
Records detailed execution data during the model forward pass in inference serving.
|
Field |
Description |
|---|---|
|
name |
Forward event mark, which indicates the forward pass of the model. |
|
relative_start_time(ms) |
Time between the first forward pass and the current forward pass on each device. |
|
start_time |
Forward pass start time. |
|
end_time |
Forward pass end time. |
|
during_time(ms) |
Forward pass execution time, in ms. |
|
bubble_time(ms) |
Bubble time between forward passes, in ms. |
|
batch_size |
Number of requests per forward pass. |
|
batch_type |
Request status in a forward pass. |
|
forward_iter |
Iteration ID of a forward pass on different ranks. |
|
dp_rank |
DP information of a forward pass. The values for the same DP domain are the same. |
|
prof_id |
Rank ID. The values for the same rank are the same. |
|
hostname |
Host name. The values for the same device are the same. |
pd_split_communication.csv
Records communication data in PD disaggregation scenarios. PD disaggregation works in cluster scenarios with multiple nodes and devices. It requires using the shared configuration file during profiling (see 2).
For details about PD disaggregation and related concepts, see Cluster Service Deployment > Prefill-Decode Disaggregation in the MindIE Motor Development Guide.
|
Field |
Description |
|---|---|
|
rid |
Request ID. |
|
http_req_time(ms) |
Request arrival time, in ms. |
|
send_request_time(ms) |
Time when the prefill node starts to send a request to the decode node, in ms. |
|
send_request_succ_time(ms) |
Time when the request is successfully sent, in ms. |
|
prefill_res_time(ms) |
Time when prefill completes, in ms. |
|
request_end_time(ms) |
Time when the request execution ends, in ms. |
pd_split_kvcache.csv
Records the KV cache transfer between prefill and decode nodes during inference based on PD disaggregation. PD disaggregation works in cluster scenarios with multiple nodes and devices. It requires using the shared configuration file during profiling (see Data Profiling).
For details about PD disaggregation and related concepts, see Cluster Service Deployment > Prefill-Decode Disaggregation in the MindIE Motor Development Guide.
|
Field |
Description |
|---|---|
|
domain |
PullKVCache event mark. |
|
rank |
Device ID. |
|
rid |
Request ID. |
|
block_tables |
block_tables information. |
|
seq_len |
Request length. |
|
during_time(ms) |
Time taken to transfer the KV cache from the prefill node to the decode node, in ms. |
|
start_datetime(ms) |
Start time for the KV cache to be transferred from the prefill node to the decode node, displayed as a specific time, in ms. |
|
end_datetime(ms) |
End time for the KV cache to be transferred from the prefill node to the decode node, displayed as a specific time, in ms. |
|
start_time(ms) |
Start time for the KV cache to be transferred from the prefill node to the decode node, displayed as a timestamp, in ms. |
|
end_time(ms) |
End time for the KV cache to be transferred from the prefill node to the decode node, displayed as a timestamp, in ms. |
coordinator.csv
Records changes in the number of requests distributed to each node during inference based on PD disaggregation. PD disaggregation works in cluster scenarios with multiple nodes and devices. It requires using the shared configuration file during profiling (see Data Profiling).
For details about PD disaggregation and related concepts, see Cluster Service Deployment > Prefill-Decode Disaggregation in the MindIE Motor Development Guide.
|
Field |
Description |
|---|---|
|
time |
Time when the number of requests changes. |
|
address |
Address distributed to the node, in the format of IP address:Port number. |
|
node_type |
Node type (prefill or decode). |
|
add_count |
Number of added requests on the current node. |
|
end_count |
Number of ended requests on the current node. |
|
running_count |
Number of running requests on the current node. |
ep_balance.csv
Records load imbalance analysis results for the GroupedMatmul operator, profiled via msPTI during DeepSeek MoE inference serving.
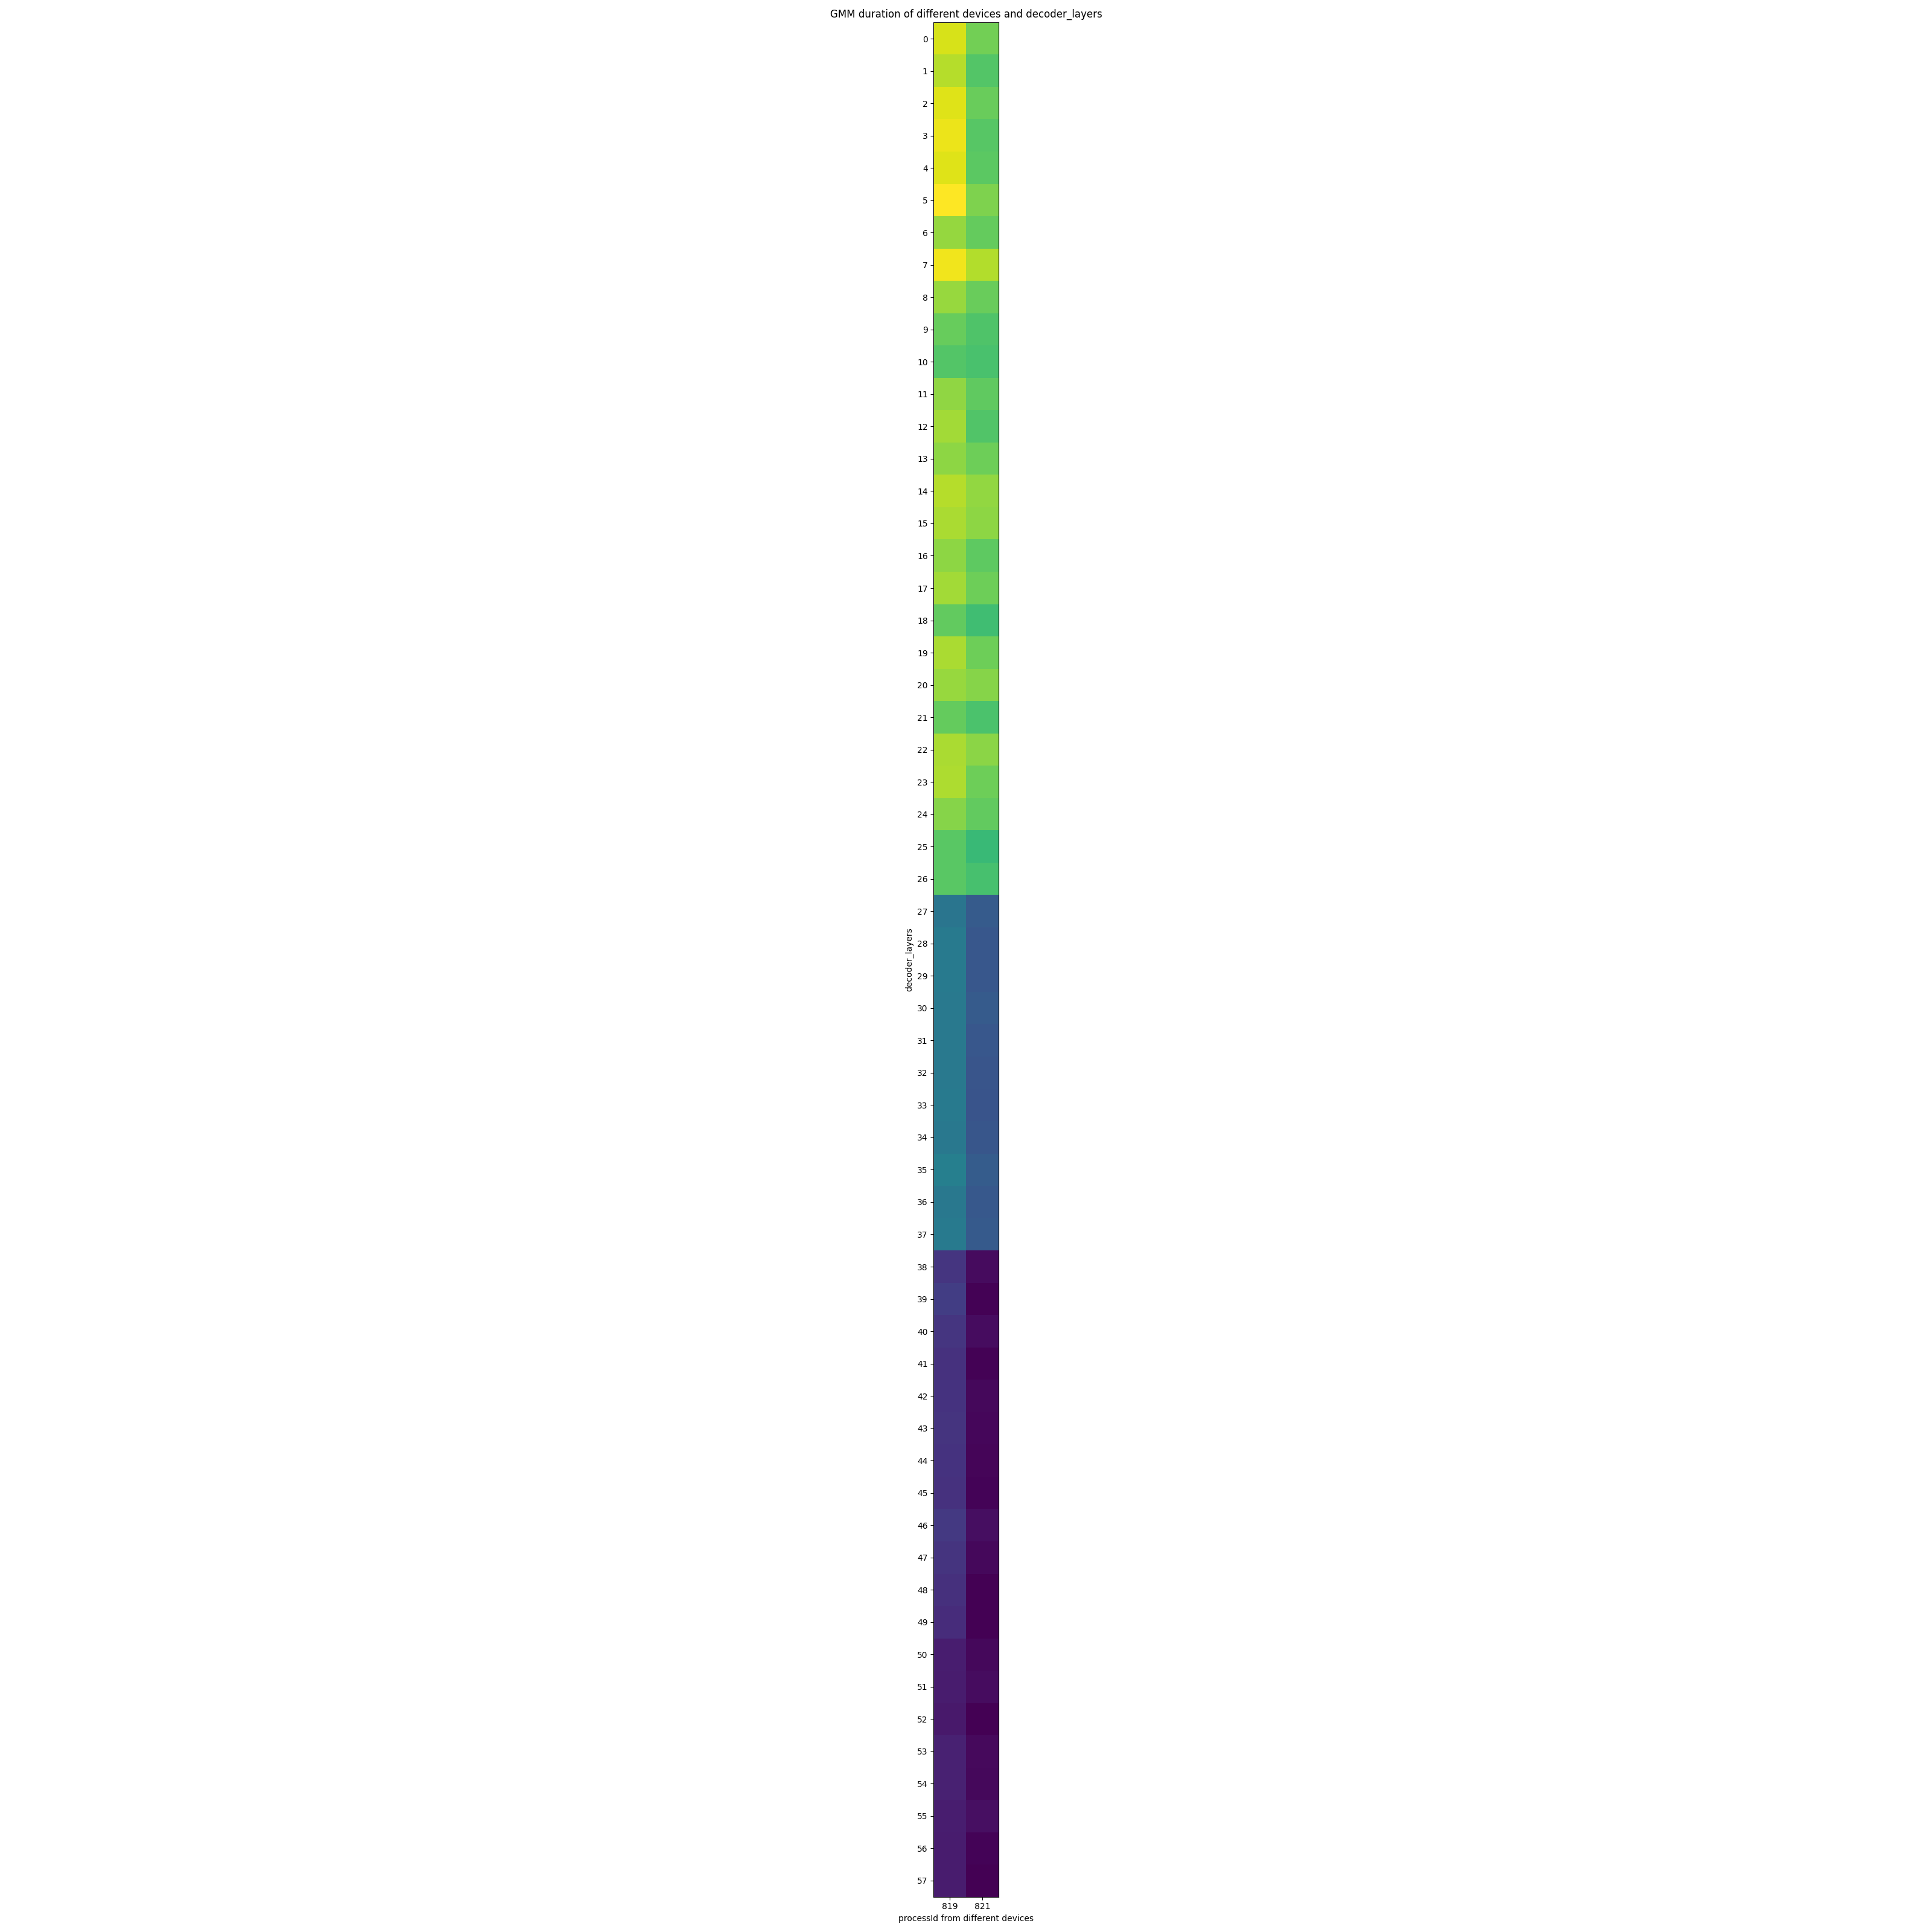
Whenever ep_balance profile data is available, executing the parsing command will automatically generate a heatmap in the output directory, as shown in Figure 1. In this heatmap, the x-axis represents the process ID for each device, while the y-axis represents the decoder layer of the model. Brighter pixels indicate longer duration. Greater color variation across rows indicates more pronounced load imbalance.
|
Field |
Description |
|---|---|
|
<Process ID> (row header) |
Process ID of each running device. |
|
<Decoder Layer> (column value) |
Decoder layer index of the model running on each device. |
moe_analysis.csv
Records fast/slow rank analysis results for the MoeDistributeCombine and MoeDistributeDispatch operators, profiled via msPTI during DeepSeek MoE inference serving.
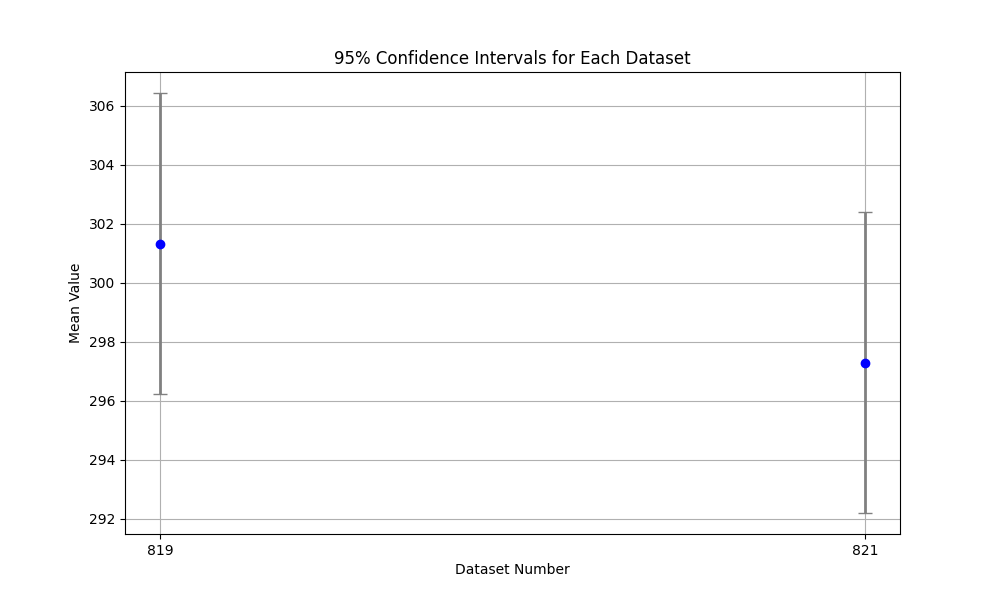
Whenever the moe_analysis profile data is available, executing the parsing command will automatically generate a box plot in the output directory, as shown in Figure 2. The x-axis represents the process ID for each device, while the y-axis represents the total execution duration. The plot displays the mean and the 2.5th/97.5th percentiles of the total execution duration. Greater disparity between ranks (wider percentile intervals) indicates more pronounced fast/slow rank issues.
|
Field |
Description |
|---|---|
|
Dataset |
Process ID of the corresponding device. |
|
Mean |
Mean total duration of the MoeDistributeCombine and MoeDistributeDispatch operators on this device. |
|
CI Lower |
2.5th percentile of the total duration for the MoeDistributeCombine and MoeDistributeDispatch operators on this device. |
|
CI Upper |
97.5th percentile of the total duration for the MoeDistributeCombine and MoeDistributeDispatch operators on this device. |
request_status.csv
Records the request status at each moment during inference serving (the number of requests in the waiting, running, or swapped state). This data can be used to generate line charts that visualize request status trends over time.
|
Field |
Description |
|---|---|
|
hostuid |
Node ID. |
|
pid |
Process ID. |
|
timestamp(ms) |
Timestamp, in ms. |
|
relative_timestamp(ms) |
Relative timestamp, in ms. |
|
waiting |
Number of requests in the waiting state. |
|
running |
Number of requests in the running state. |
|
swapped |
Number of requests in the swapped state. |
{host_name}_eplb_{i}_summed_hot_map_by_expert.png
This is an expert hotspot heatmap. In Figure 3, pixel brightness reflects hotspot intensity (see the colorbar on the right), that is, brighter pixels signifies higher heat.
- host_name indicates the device name.
- i indicates the number of load balancing table updates during the serving profiling period when dynamic load balancing is enabled on MindIE. If dynamic load balancing is disabled, i is 0.
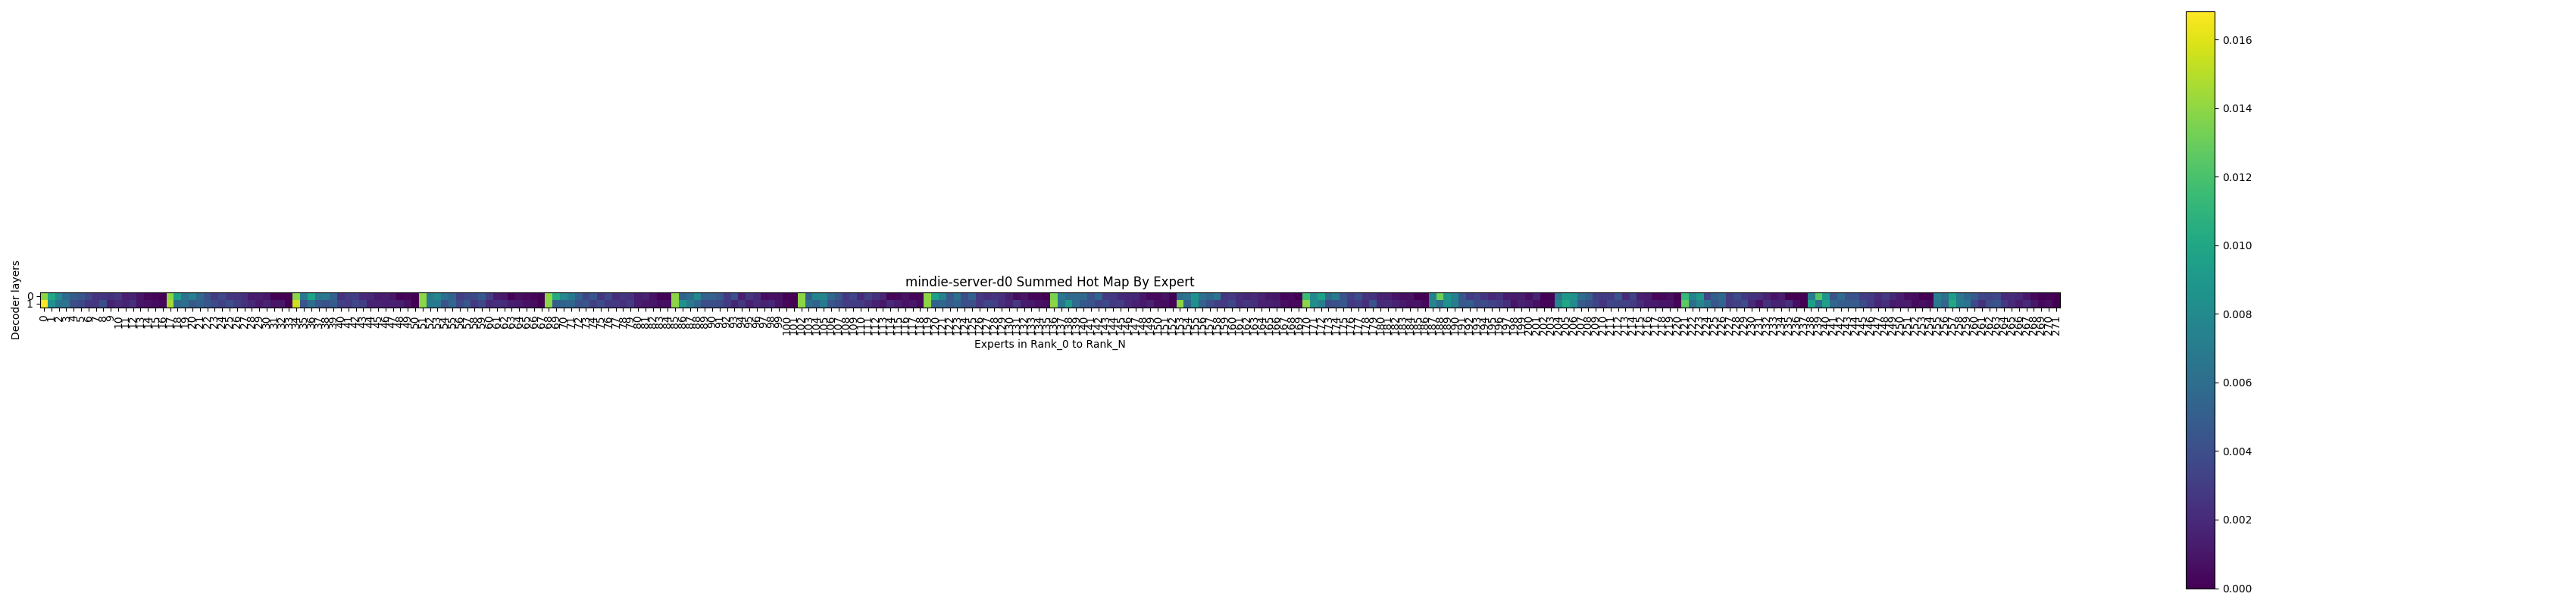
The x-axis represents the expert ID, while the y-axis represents the MoE layer of the model.
In the model instance, Rank_ID is sorted in ascending order, with experts indexed sequentially within each rank. For example, in a configuration with 16 ranks and 17 experts per rank, expert ID 42 corresponds to expert_7 (the 8th expert) on Rank_2 (the 3rd rank).
{host_name}_eplb_{i}_summed_hot_map_by_rank.png
This is an expert hotspot heatmap. In Figure 4, pixel brightness reflects hotspot intensity (see the colorbar on the right), that is, brighter pixels signifies higher heat.
- host_name indicates the device name.
- i indicates the number of load balancing table updates during the serving profiling period when dynamic load balancing is enabled on MindIE. If dynamic load balancing is disabled, i is 0.
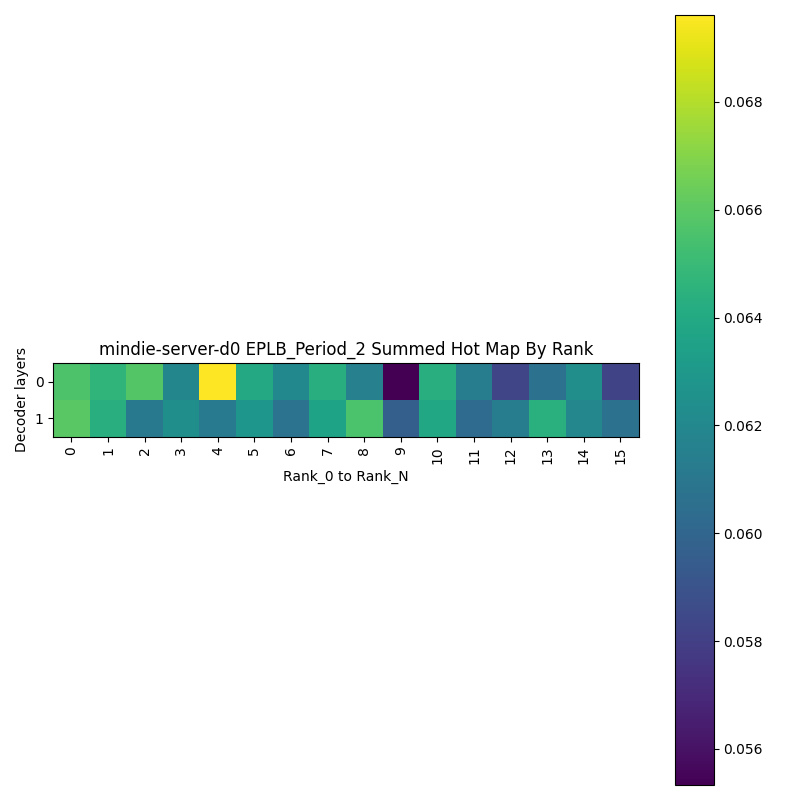
The x-axis represents the rank ID, while the y-axis represents the MoE layer of the model.
{host_name}_eplb_{i}_summed_hot_map_by_model_expert.png
This is an expert hotspot heatmap. In Figure 5, pixel brightness reflects hotspot intensity (see the colorbar on the right), that is, brighter pixels signifies higher heat.
- host_name indicates the device name.
- i indicates the number of load balancing table updates during the serving profiling period when dynamic load balancing is enabled on MindIE. If dynamic load balancing is disabled, i is 0.
- This heatmap is generated only when dynamic load balancing of MindIE is enabled.
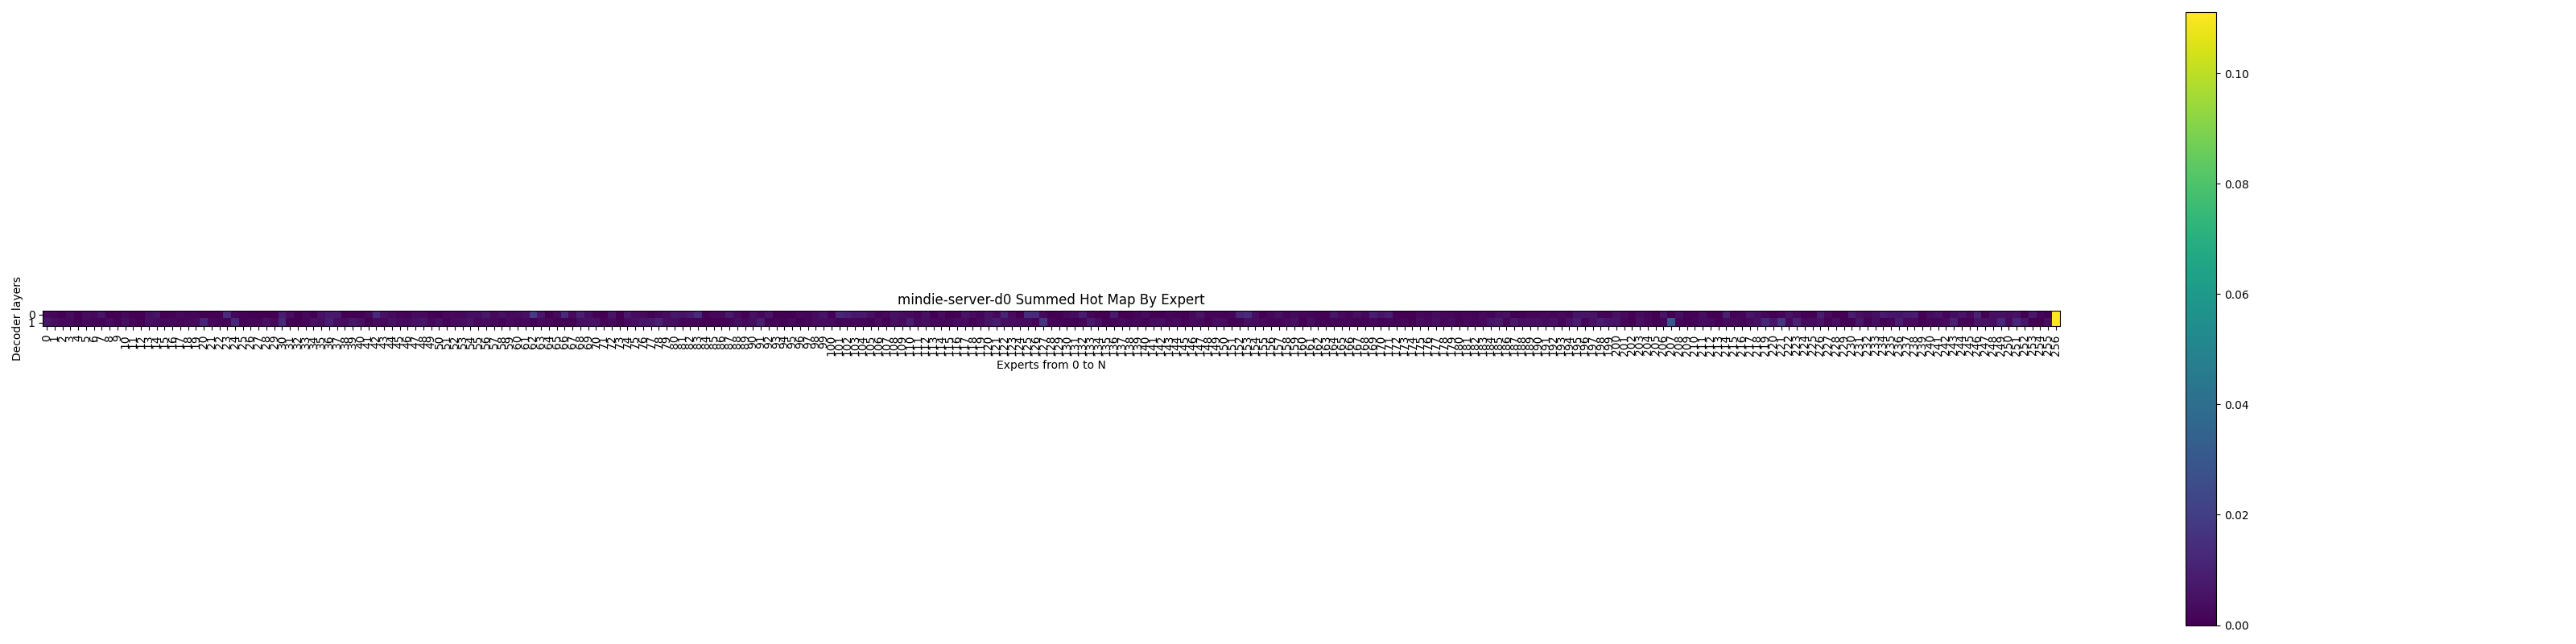
The x-axis represents the expert ID, with shared experts positioned at the end of the sequence. The y-axis represents the MoE layer of the model.
{host_name}_balance_ratio.png
This is a line chart of expert load imbalance. Figure 6 shows the degree of expert load imbalance over time.

The horizontal coordinate tokens num indicates the number of model inference rounds, and the vertical coordinate balance ratio indicates the model load imbalance degree, which is calculated based on the standard deviation of expert popularity.
The red dotted line indicates a change in the expert load balancing table. The corresponding x-axis value represents the system's local time, which is averaged across devices due to time drift. For accurate results, ensure that all devices have synchronized local time before profiling.