Timeline and Summary Data
trace_view.json
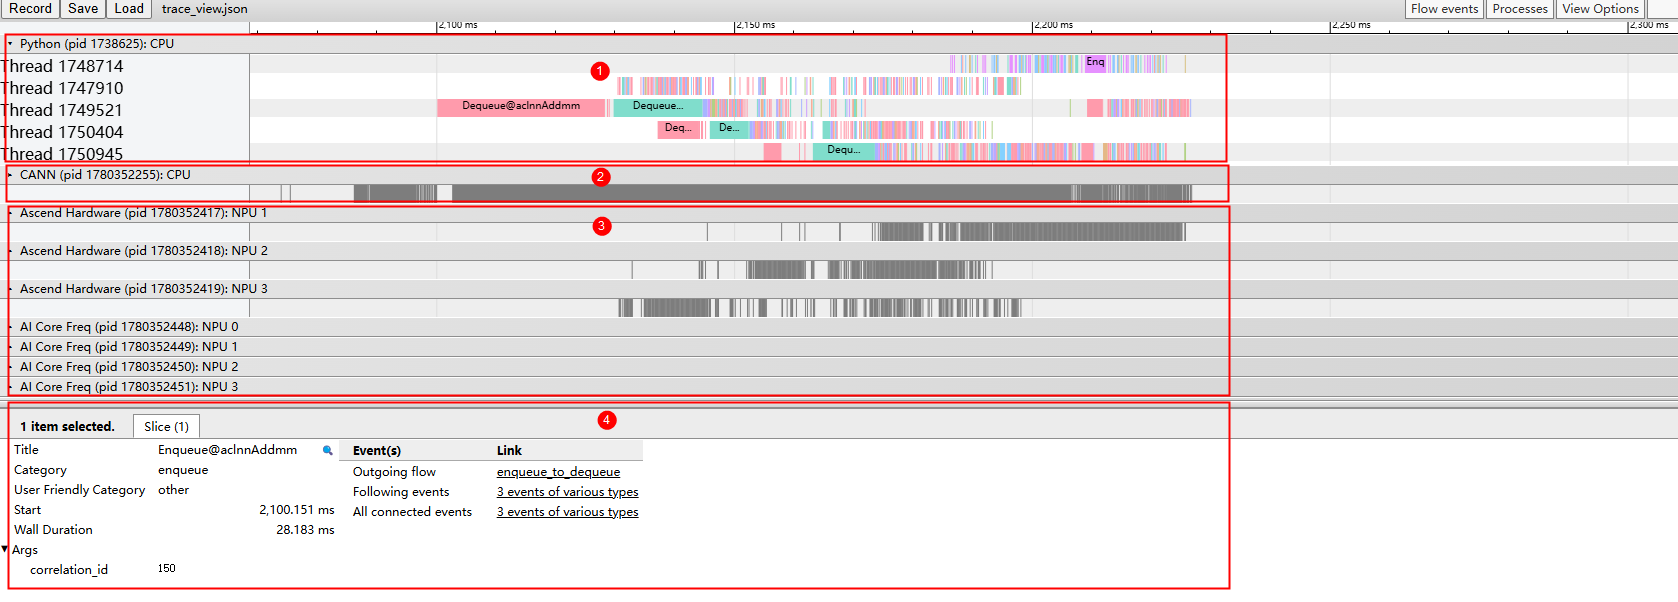
As shown in Figure 1, trace data is displayed in the following areas:
- Area 1: upper-layer application data, including the time consumption information of upper-layer application operators.
- Area 2: data at the CANN layer, including the time consumption data of the AscendCL, GE, and Runtime components.
- Area 3: bottom-layer NPU data, including the time consumption data of Task Scheduler, iteration trace data, and other system data of the AI processor.
- Area 4: details about each operator and API in a trace event, which are displayed when you click the trace event.

The trace_view.json file can be opened in MindStudio Insight, chrome://tracing/, and https://ui.perfetto.dev/.
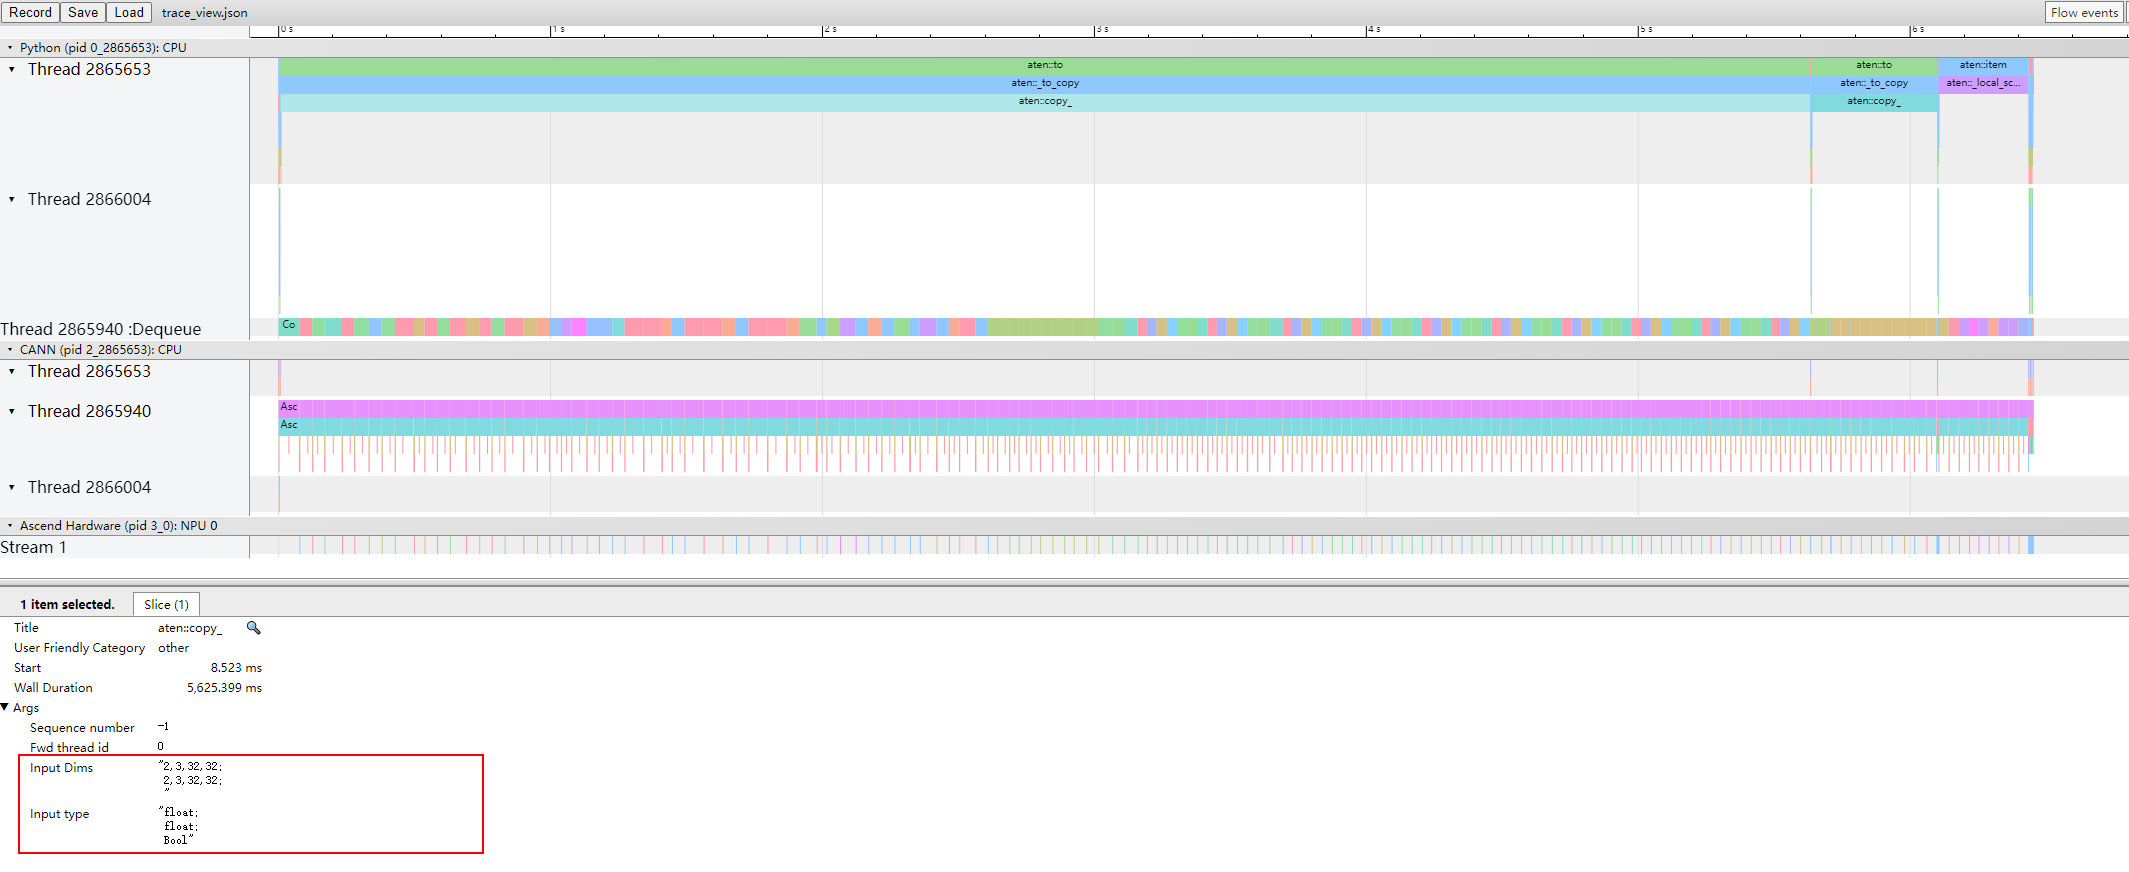
When record_shapes is enabled, Input Nums and Input type are displayed for upper-layer application operators in trace_view.
This function is supported only in PyTorch scenarios but not in MindSpore scenarios.
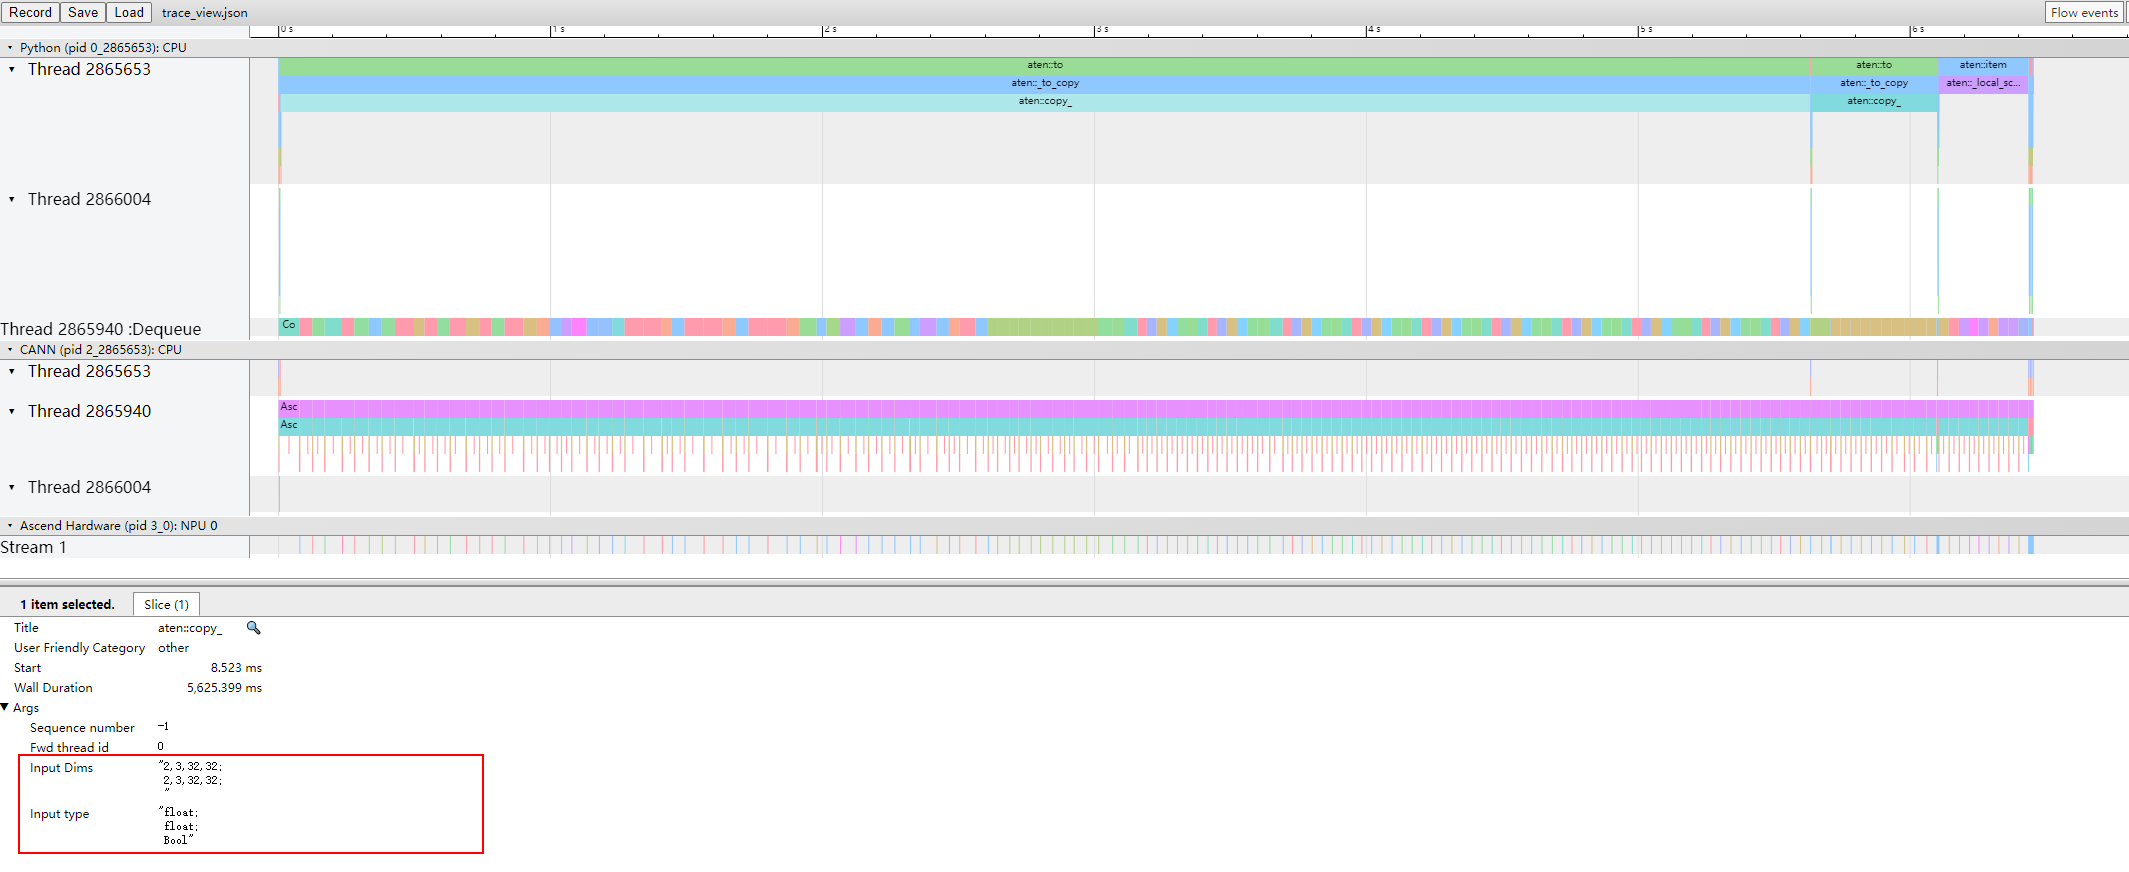
When with_stack is enabled, Call stack is displayed for upper-layer application operators in trace_view.
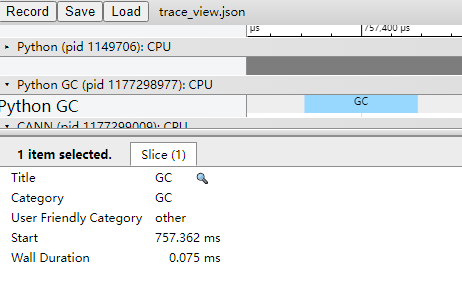
The time segment of the Python GC layer shown in Figure 4 indicates the execution time of this GC run.
GC execution blocks the current process, and the process must wait until GC completes. If the GC duration is excessively long, you can mitigate process blocking caused by GC by adjusting GC parameters (see gc.set_threshold in Garbage Collector interface).
This function is supported only in PyTorch scenarios.
kernel_details.csv


The file contains information about all operators executed on the NPU. If the user's frontend calls schedule to insert markers into steps, the Step Id field is included. However, if warmup (not 0) is set for schedule and asynchronous operator execution operations exist after each step of training or online inference, the asynchronous operator execution operations may be profiled in the warmup phase. As a result, the Step Id field does not exist in kernel_details.csv.
Table 1 describes the fields.
During the configuration of the aic_metrics parameter under experimental_config, corresponding fields are added to the kernel_details.csv file based on the aic_metrics configuration under experimental_config. For details about the added content, see experimental_config Parameter Description. For details about the fields in the file, see op_summary (Operator Details).
Field |
Description |
|---|---|
Step Id&Step ID |
Iteration ID. |
Device_id |
Device ID. |
Model ID |
Model ID. |
Task ID |
Task ID. |
Stream ID |
ID of the stream where a task is located. |
Name |
Operator name. |
Type |
Operator type. |
OP State |
Dynamic and static information about an operator. The value dynamic indicates a dynamic operator, and the value static indicates a static operator. The communication operator does not have this state, so N/A is displayed. This field is reported only when --task-time is l1. If --task-time is l0, N/A is displayed. |
Accelerator Core |
AI acceleration core type, including AI Core and AI CPU. |
Start Time(us) |
Operator execution start time, in μs. |
Duration(us) |
Execution duration of the current operator, in μs. |
Wait Time(us) |
Operator execution wait time, in μs. |
Block Num |
Number of running blocks. This number corresponds to the number of cores during task running. |
Mix Block Num |
Some operators are executed simultaneously on both the AI Core and Vector Core. The Block Num of the primary accelerator is described in the Block Num field, and the Block Num of the secondary accelerator is described in this field. If task_time is set to l0, this field is not collected and is displayed as N/A. ( |
HF32 Eligible |
Whether to use the HF32 precision flag. YES indicates that the HF32 precision flag is used, while NO indicates that the HF32 precision flag is not used. |
Input Shapes |
Operator input shape. |
Input Data Types |
Input data types. |
Input Formats |
Input formats. |
Output Shapes |
Operator output shape. |
Output Data Types |
Output data types. |
Output Formats |
Output data formats. |
memory_record.csv

The file contains the device memory usage records of PTA and GE, including the allocated memory and the memory occupation time. Table 2 describes the fields.
Field |
Description |
|---|---|
Component |
Components, including:
|
Timestamp(us) |
Timestamp, which records the start time of device memory usage, in μs. |
Total Allocated(MB) |
Total allocated memory, in MB. |
Total Reserved(MB) |
Total reserved memory, in MB. |
Total Active(MB) |
Total memory requested by streams, including the unreleased memory that is reused by other streams, in MB. |
Stream Ptr |
Memory address of an AscendCL stream, which is used to mark different AscendCL streams. |
Device Type |
Device type and device ID. Only NPUs are involved. |
operator_memory.csv

The file contains the memory usage details of operators, including the memory required for executing specific operators on the NPU and the occupation time. The memory is allocated to PTA and GE. Table 3 describes the fields.
If negative or null values exist in the operator_memory.csv file, see Negative and Empty Value Description for details.
Field |
Description |
|---|---|
Name |
Operator name. |
Size(KB) |
Size of the memory occupied by the operator, in KB. |
Allocation Time(us) |
Tensor memory allocation time, in μs. |
Release Time(us) |
Tensor memory deallocation time, in μs. |
Active Release Time(us) |
Actual time when the memory is returned to the memory pool, in μs. |
Duration(us) |
Memory occupation time (Release Time – Allocation Time), in μs. |
Active Duration(us) |
Actual memory occupation time (Active Release Time – Allocation Time), in μs. |
Allocation Total Allocated(MB) |
Total allocated memory during operator memory allocation, in MB. (If the operator name begins with aten, the memory is the PTA memory. If the operator name begins with cann, the memory is the GE memory.) |
Allocation Total Reserved(MB) |
Total occupied memory during operator memory allocation, in MB. (If the operator name begins with aten, the memory is the PTA memory. If the operator name begins with cann, the memory is the GE memory.) |
Allocation Total Active(MB) |
Total memory requested by the current stream during operator memory allocation, including the unreleased memory reused by other streams. The unit is MB. |
Release Total Allocated(MB) |
Total allocated memory during operator memory deallocation, in MB. (If the operator name begins with aten, the memory is the PTA memory. If the operator name begins with cann, the memory is the GE memory.) |
Release Total Reserved(MB) |
Total occupied memory during operator memory deallocation, in MB. (If the operator name begins with aten, the memory is the PTA memory. If the operator name begins with cann, the memory is the GE memory.) |
Release Total Active(MB) |
Total memory that is reused by other streams during operator memory deallocation, in MB. (If the operator name begins with aten, the memory is the PTA memory. If the operator name begins with cann, the memory is the GE memory.) |
Stream Ptr |
Memory address of an AscendCL stream, which is used to mark different AscendCL streams. |
Device Type |
Device type and device ID. Only NPUs are involved. |
npu_module_mem.csv


The npu_module_mem.csv data is automatically collected during the profiling process. It includes the component-level memory usage, primarily recording the memory occupied by components at the time of execution on the NPU. Table 4 describes the fields.
Field |
Description |
|---|---|
Device_id |
Device ID. |
Component |
Component name. |
Timestamp(us) |
Timestamp, in μs. It indicates the time when the memory is occupied by the component. |
Total Reserved(MB)&Total Reserved(KB) |
Memory usage, in MB for PyTorch and KB for MindSpore. |
Device |
Device type and device ID. Only NPUs are involved. |
operator_details.csv
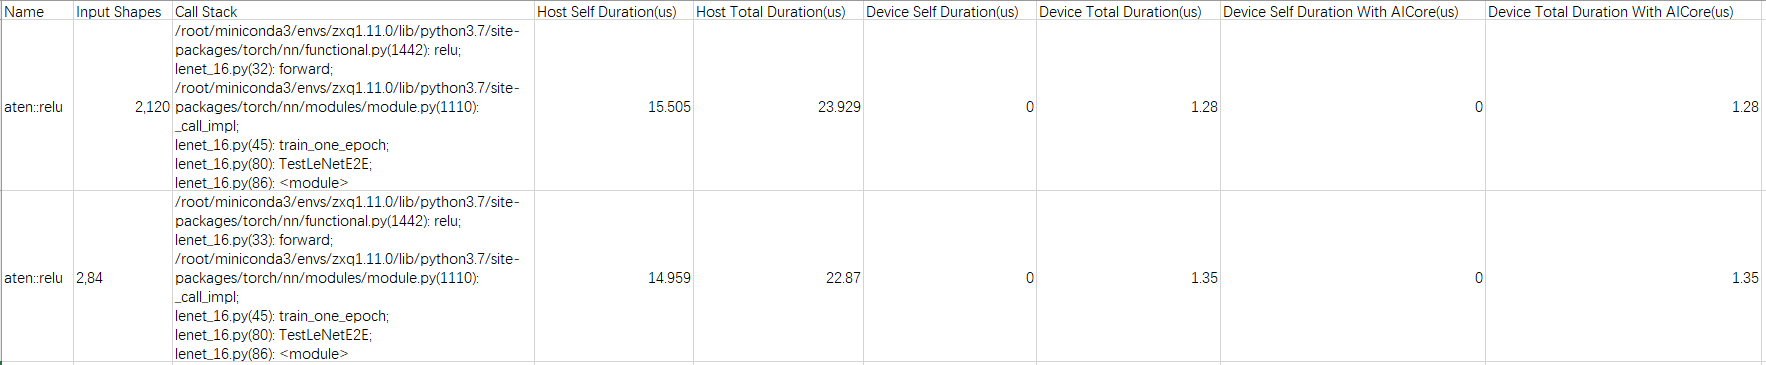
Table 5 describes the information contained in the operator_details.csv file.
Field |
Description |
|---|---|
Name |
Operator name. |
Input Shapes |
Shape information. |
Call Stack |
Function call stack information. It is controlled by the with_stack field. |
Host Self Duration(us) |
Time consumed by operators on the host (excluding other internally called operators), in μs. |
Host Total Duration(us) |
Time consumed by operators on the host, in μs. |
Device Self Duration(us) |
Time consumed by operators on the device (excluding other internally called operators), in μs. |
Device Total Duration(us) |
Time consumed by operators on the device, in μs. |
Device Self Duration With AICore(us) |
Time consumed by operators executed on the AI Core on the device (excluding internally called operators), in μs. |
Device Total Duration With AICore(us) |
Time consumed by operators executed on the AI Core on the device, in μs. |
step_trace_time.csv


Table 6 describes the time statistics of computation and communication in iterations.
Field |
Description |
|---|---|
Device_id |
Device ID. |
Step |
Number of iterations. |
Computing |
Total computation time of operators on the NPU, in μs. |
Communication(Not Overlapped) |
Communication time, which is the total communication time minus the overlapping time of computation and communication. The unit is μs. |
Overlapped |
Overlapping time of computation and communication, in μs. Longer overlapping time indicates better parallelism between computation and communication. Ideally, communication and computation are completely overlapped. |
Communication |
Total communication time of operators on the NPU, in μs. |
Free |
Total iteration time minus the computation and communication time, in μs. It may include initialization, data loading, and CPU computation time. |
Stage |
Stage time, indicating the time except the receive operator time, in μs. |
Bubble |
Total receive time, in μs. |
Communication(Not Overlapped and Exclude Receive) |
Total communication time minus the overlapping time of computation and communication and the receive operator time. The unit is μs. |
Preparing |
Duration from the time when the iteration starts to the time when the first computing or communication operator runs. The unit is μs. |
data_preprocess.csv
The data_preprocess.csv file records the AI CPU data. See aicpu (AI CPU Operator Time Consumption Details) for the example and field description. The actual results may vary.
l2_cache.csv
See l2_cache (L2 Cache Hit Ratio) for the example and field description. The actual results may vary.
op_statistic.csv
See op_statistic (Operator Calling Times and Time Consumption) for the example and field description. The actual results may vary.
api_statistic.csv
See api_statistic_*.csv File for the example and field description. The actual results may vary.
pcie.csv
See pcie_*.csv File for the example and field description. The actual results may vary.
hccs.csv
See hccs_*.csv File for the example and field description. The actual results may vary.
nic.csv
See nic_*.csv File for the example and field description. The actual results may vary.
roce.csv
See roce_*.csv File for the example and field description. The actual results may vary.