aclInit
Applicable Products
|
Product |
Supported |
|---|---|
|
|
√ |
|
|
√ |
|
|
√ |
|
|
√ |
|
|
√ |
|
|
√ |
Function
Performs initialization.
aclInit must be called before application development using acl APIs. Otherwise, errors may occur during the initialization of internal resources, causing service exceptions.
Prototype
1
|
aclError aclInit(const char *configPath) |
Parameters
|
Parameter |
Input/Output |
Description |
|---|---|---|
|
configPath |
Input |
Pointer to the path (including the file name) of the configuration file. The configuration file is in JSON format. A JSON file allows up to 10 levels of curly brackets and square brackets, respectively. During initialization, you can use this configuration file to enable dump, configure profiling, and set other options. For details, see the configuration examples of each function in the following sections. To use the default configurations, pass NULL or an empty JSON configuration file with only a pair of curly brackets {} to the aclInit call. |
Returns
0 on success; otherwise, failure. For details, see aclError.
Restrictions
- aclInit can be called multiple times in a process, but the aclFinalize or aclFinalizeReference API must be called for deinitialization.
- The configuration must be consistent each time aclInit is called. Otherwise, only the configuration of the first call is valid. Calling the aclInit API again may cause errors.
- To be compatible with earlier versions, if the aclInit API is called repeatedly, the error code ACL_ERROR_REPEAT_INITIALIZE will be returned. You can ignore this error and continue to process services.
- The aclInit and aclFinalize APIs can be called repeatedly for initialization and deinitialization, respectively. Only sequential calls are available for the two APIs.
aclInit --> service processing --> aclFinalize --> aclInit --> service processing --> aclFinalize
After you call aclInit multiple times, you only need to call aclFinalize once to perform deinitialization. The aclInit reference count will be reset to 0.
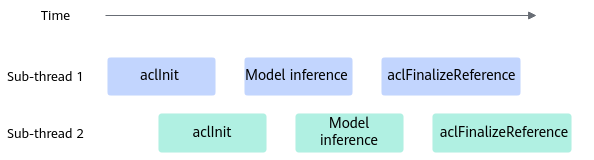
- If the aclInit and aclFinalizeReference APIs are called for initialization and deinitialization, respectively, the two APIs need to be called in pairs.
aclFinalizeReference involves reference counting. Each time aclInit is called, the reference count increases by 1. Each time aclFinalizeReference is called, the reference count decreases by 1. Deinitialization is performed only when the reference count decreases to 0.
Initialization and deinitialization can be performed repeatedly. Both sequential and concurrent calls are available for the two APIs.

Model Dump Configuration and Single-Operator Dump Configuration
Model dump configuration is used to export the input and output data of operators at each layer in a model. Single-operator dump configuration is used to export the input and output data of a single operator. The exported data is used to compare with that of a specified model or operator to locate accuracy issues. For details about configuration examples, see Accuracy Analyzer. This dump configuration is disabled by default.
To enable the dump configuration through this API, you need to use the dump_path parameter to configure the path for storing dump data. For details about the parameter, see Preparing Dump Data of an Offline Model in Accuracy Analyzer.
Example of model dump configuration:
1 2 3 4 5 6 7 8 9 10 11 12 13 14 15 16 17 18 19 20 21 |
{ "dump":{ "dump_list":[ { "model_name":"ResNet-101" }, { "model_name":"ResNet-50", "layer":[ "conv1conv1_relu", "res2a_branch2ares2a_branch2a_relu", "res2a_branch1", "pool1" ] } ], "dump_path":"/home/output", "dump_mode":"output", "dump_op_switch":"off", "dump_data":"tensor" } } |
Example of single-operator dump configuration:
1 2 3 4 5 6 7 8 |
{ "dump":{ "dump_path":"/home/output", "dump_list":[{}], "dump_op_switch":"on", "dump_data":"tensor" } } |
Dump Configuration for Exception Operators
This configuration is used to export the input and output data, workspace information, tiling information, and other information of exception operators. The exported data is used to analyze AI Core errors. This dump configuration is disabled by default.
For details about how to collect and locate AI Core errors, see Typical Faults > AI Core Error Locating in Troubleshooting.
You can enable dump for exception operators by setting dump_scene. The following gives a configuration example, indicating that lightweight exception dump is enabled:
{
    "dump":{
        "dump_path":"output",
        "dump_scene":"aic_err_brief_dump"
    }
}
The details are as follows:
- dump_scene can be set to:
- aic_err_brief_dump: lightweight exception dump, which is used to export the input, output, and workspace data of exception operators of AI Core.
- aic_err_norm_dump: common exception dump, which is used to export the shape, data type, format, and attribute information in addition to the lightweight exception dump.
- aic_err_detail_dump: exports the internal storage, register, and call stack information of AI Core in addition to the lightweight exception dump.
When configuring this parameter, note that:
- This parameter is only available for the
Atlas A3 training products /Atlas A3 inference products andAtlas A2 training products /Atlas A2 inference products , with drivers of version 25.0.RC1 or later.You can click here to download the driver installation package of Ascend HDK 25.0.RC1 or later on the Firmware and Drivers page and install or upgrade the drivers by referring to the document of the corresponding version.
- During dump file export, the AI Core where an exception operator is located is suspended, which may affect the execution of other processes on the device. After dump files are exported, the AI Core automatically restores. Therefore, you are not advised to use aic_err_detail_dump when multiple host-side user service processes share the same device.
- After dump files are exported, host-side user service processes are forcibly exited. Errors reported during the forcible exit are not used as the input for AI Core problem analysis.
- If aic_err_detail_dump is configured and dump files are generated but not *.core files, aic_err_detail_dump is not enabled successfully. In this case, aic_err_brief_dump will be used instead.
- This parameter is only available for the
- lite_exception: light exception dump. It is provided to be compatible with earlier versions and is equivalent to aic_err_brief_dump.
- dump_path is an optional parameter, indicating the path for storing exported dump files.
The priorities of the dump file storage paths are as follows: Environment variable NPU_COLLECT_PATH > Environment variable ASCEND_WORK_PATH > dump_path in the configuration file > Current execution directory of the application. For details about the environment variables, see Environment Variables.
- For details about how to view the content of an exported dump file, see Parsing Dump Files in Troubleshooting.
If dump_scene is set to aic_err_detail_dump, use msDebug to view the content of an exported dump file. For details, see Operator Development Tool.
- The dump configuration for exception operators cannot be enabled if the model dump configuration or single-operator dump configuration is enabled.
Dump Configuration for Overflow/Underflow Operators
This configuration is used to export the input and output data of overflow/underflow operators in a model. The exported data is used to analyze the cause of overflow/underflow and locate model accuracy issues. This dump configuration is disabled by default.
{
    "dump":{
        "dump_path":"output",
        "dump_debug":"on"
    }
}
- If dump_debug is not set or set to off, the overflow/underflow operator configuration is disabled.
- If the overflow/underflow operator configuration is enabled, dump_path must be set to specify the path for storing exported dump files.
After obtaining the exported data files, parse the files by referring to Collecting and Analyzing Data of Overflow/Underflow Operators in Accuracy Analyzer.
dump_path can be either absolute or relative.- An absolute path starts with a slash (/), for example, /home.
- A relative path starts with a directory name, for example, output.
- The overflow/underflow operator configuration cannot be enabled if the model dump configuration or single-operator dump configuration is enabled. Otherwise, an error is returned.
- Only overflow/underflow data of AI Core operators can be collected.
Dump Watch Configuration for Operators
This configuration is used to enable the watch mode for the output data of a specified operator. After locating the accuracy issues of some operators and excluding the computation issues of the operators, you can enable the dump watch mode if you suspect that the accuracy issues are caused by memory overwriting by other operators. The dump watch mode is disabled by default.
Set dump_scene to watcher to enable dump watch for operators. Below is an example of the content in the configuration file. The configuration effect is as follows: (1) After operators A and B are executed, the output of operators C and D is dumped; (2) After operators C and D are executed, the output of operators C and D is also dumped. The dump files of operators C and D in (1) will be compared with those in (2) to check whether operator A or B overwrites the output memory of operator C or D.
{
    "dump":{
        "dump_list":[
            {
                "layer":["A", "B"],
                "watcher_nodes":["C", "D"]
            }
        ],
        "dump_path":"/home/",
        "dump_mode":"output",
        "dump_level":"op",
        "dump_scene":"watcher"
    }
}
The details are as follows:
- Dump watch cannot be applied in the single-operator API dump scenario.
- If dump watch is enabled for operators, the overflow/underflow operator dump (by setting dump_debug) and single-operator dump (by setting dump_op_switch) cannot be enabled. Otherwise, an error will be reported.
- In dump_list, layer is the operators that may overwrite the memory of other operators, and watcher_nodes is the operators whose output memory may be overwritten by other operators. If the output of an operator is overwritten, the operator accuracy may decrease.
- If layer is not specified, the output of operators listed in watcher_nodes will be dumped after all operators that support dump in the model are executed.
- If any operator in layer and watcher_nodes is not in a static graph or static subgraph, the configuration does not take effect.
- If an operator is in both layer and watcher_nodes or an operator in layer is a collective communication operator (the operator type starts with Hcom, for example, HcomAllReduce), only the dump files of operators in watcher_nodes will be exported.
- For a fused operator, use its name after fusion when you add it to watcher_nodes. Otherwise, dump files cannot be exported.
- Currently, model_name cannot be configured in dump_list.
- If the dump watch configuration is enabled for operators, dump_path must be set to specify the path for storing exported dump files.
The exported dump files cannot be viewed using a text tool. To view the content of a dump file, convert the dump file to a NumPy file and then view the NumPy file using Python. For details about the conversion procedure, see Viewing Dump Files in Accuracy Analyzer.
dump_path can be either absolute or relative.- An absolute path starts with a slash (/), for example, /home.
- A relative path starts with a directory name, for example, output.
- dump_mode is used to control what data of operators in watcher_nodes can be exported. Currently, the value can only be output.
- dump_level is used to set the level of dump data. The value can be:
- op: dumps data at the operator level.
- kernel: dumps data at the kernel level.
- all (default): dumps data at both the op level and the kernel level.
If the default value is used, there are a large number of dump files, for example, dump files starting with aclnn. If you have requirements on the dump performance or the memory resources are limited, you can set this parameter to the op level to improve the dump performance and reduce the number of dump files.
Note: An operator represents a computational logic (such as addition, subtraction, multiplication, and division). A kernel is the implementation that executes this computational logic, and requires allocation of specific computing devices to complete computation.
Dump Configuration for Operator Kernel Debugging Information
This dump configuration is used to export the debugging information of the Ascend C operator kernel to locate operator problems. This dump configuration is disabled by default.
This configuration is only available for the following models:
Set the dump_kernel_data parameter to enable the dump of operator kernel debugging information. The following gives a configuration example:
{
    "dump":{
        "dump_kernel_data":"printf,assert",
        "dump_path":"/home/"
    }
}
The details are as follows:
- dump_kernel_data: specifies the type of data to be exported. Multiple types can be configured and are separated by commas (,). If this field is not configured but the model dump configuration and single-operator dump configuration are enabled, all debugging information is exported by default.
Currently, the value can be:
- all: exports the output data of all types.
- printf: exports the output data generated through AscendC::printf.
- tensor: exports the output data generated through AscendC::DumpTensor.
- assert: exports the output data generated through assert/ascendc_assert.
- timestamp: exports the output data generated through AscendC::PrintTimeStamp.
- dump_path: specifies the path for storing dump files. This parameter is mandatory if dump is enabled for operator kernel debugging information. The path can be an absolute path or a relative path.
The priorities of the dump file storage paths are as follows: Environment variable ASCEND_DUMP_PATH > Environment variable ASCEND_WORK_PATH > dump_path in the configuration file. For details about the environment variables, see Environment Variables.
The exported dump files cannot be viewed using a text tool. To view the content of a dump file, use the show_kernel_debug_data tool to parse the debugging information into a readable format. For details about how to use the tool, see show_kernel_debug_data in Ascend C Operator Development.
Profiling Configuration
For the configuration example, description, and restrictions of profiling configuration, see Using the acl.json Configuration File for Profiling in Performance Tuning Tool. Profiling configuration is disabled by default.
Dump configuration and profiling configuration are mutually exclusive. The dump operation may affect system performance, resulting in inaccurate profile data collected by Profiling.
Operator Cache Aging Configuration
To reduce the memory footprint and balance the call performance when you execute a single operator in a single-operator model (the aclopUpdateParams API excluded), you can use the max_opqueue_num parameter to configure the maximum length of the "operator type and single-operator model" mapping queue. If the length of the mapping queue reaches the maximum, the least used mapping information and single-operator models in the cache are deleted before the most recent mapping information and the corresponding single-operator model are loaded. The default maximum length of the mapping queue is 20000.
In single-operator model execution, operator execution is based on graph IR. First, the operator is compiled (for example, the ATC tool is used to compile the single-operator description file defined by Ascend IR into an operator .om model file). Then, an acl API (for example, aclopSetModelDir) is called to load the operator model. Finally, an acl API (for example, aclopExecuteV2) is called to execute the operator.
You can use max_opqueue_num to set the maximum length of the "operator type and single-operator model" mapping queue to age operator cache information. The following gives a configuration example:
{
        "max_opqueue_num": "10000"
}
The details are as follows:
- For statically loaded operators (a single operator is compiled to generate an *.om file and then loaded using an API such as aclopSetModelDir), the aging configuration is invalid and the operator information will not be aged.
- For operators that are compiled online (operators are compiled directly by calling an acl API such as aclopCompile or aclopCompileAndExecuteV2), the API loads a single-operator model based on input parameters. In this case, the aging configuration is valid.
If an operator is compiled and executed by using aclopCompile and aclopExecuteV2, promptly execute the operator in case the operator information is aged. If that happens, you will need to recompile the operator. You are advised to use aclopCompileAndExecuteV2 instead, which completes operator compilation and execution as one action.
- An API maintains two mapping queues, one for static-shape and the other for dynamic-shape operators. However, their maximum lengths are both determined by the max_opqueue_num parameter.
- The value of max_opqueue_num is the sum of the number of single-operator models with statically loaded operators and the number of single-operator models with operators compiled online. Therefore, the value of max_opqueue_num must be greater than the number of single-operator models with statically loaded operators that are available in the current process; otherwise, the information about operators compiled online cannot be aged.
Error Information Report Mode Configuration
This configuration is used to control the aclGetRecentErrMsg API to obtain error information by process or thread. By default, error information is obtained by thread.
Value range of the err_msg_mode parameter: 0 is the default value, indicating that error information is obtained by thread. 1 indicates that error information is obtained by process.
The following gives a configuration example:
{
        "err_msg_mode": "1"
}
Example of Default Device Configuration
This configuration is used to configure the default compute device. If the device is specified through aclrtSetDevice, aclrtSetDevice has a high priority. If you want to explicitly create a context after enabling the default device configuration, you need to call aclrtSetDevice. Otherwise, service exceptions may occur.
The value of default_device is a device ID, which can be 0 or a decimal positive integer. You can call aclrtGetDeviceCount to obtain the number of available devices. The device ID range is [0, (Available device count – 1)].
The following gives a configuration example:
{
    "defaultDevice":{
        "default_device":"0"
    }
}
Example of AI Core Stack Size Configuration
This configuration is used to control the size of the stack space allocated to each AI Core during kernel execution in a process. The default value is 32 KB.
The
The
The
Use aicore_stack_size to set the stack size, in bytes. The value must meet the following requirements:
- The value of aicore_stack_size must be an integer multiple of 16 KB. Otherwise, the value will be rounded up to meet this requirement.
- The minimum value of aicore_stack_size is 32 KB. If the input value is smaller than that, the default value 32 KB will be used.
- The maximum value of aicore_stack_size for each product is as follows:
For the
Ascend 950PR /Ascend 950DT , the maximum value of aicore_stack_size is 128 KB.For the
Atlas A3 training products /Atlas A3 inference products , the maximum value of aicore_stack_size is 192 KB.For the
Atlas A2 training products /Atlas A2 inference products , the maximum value of aicore_stack_size is 192 KB.For the
Atlas 200I/500 A2 inference products , the maximum value of aicore_stack_size is 7,680 KB.
The following gives a configuration example:
{
    "StackSize":{
        "aicore_stack_size":32768
    }
}
Example of SIMT Operator Stack Size Configuration
Single Instruction Multiple Thread (SIMT) stack size configuration is used to control the stack size of an SIMT operator in each thread and the divergence stack size of an SIMT operator, in bytes.
Only the
simt_stack_size: specifies the stack size of an SIMT operator in each thread, in bytes.
simt_divergence_stack_size: specifies the divergence stack size of an SIMT operator, in bytes.
The values of simt_stack_size and simt_divergence_stack_size must be an integer multiple of 128. Otherwise, the API automatically rounds up the value to meet this requirement.
The following gives a configuration example:
{
  "StackSize": {
    "simt_stack_size": 1024,
    "simt_divergence_stack_size": 512
  }
}
Example of SIMT Printf FIFO Size Configuration
This configuration is used to control the FIFO buffer size available for Printf output in SIMT operators, in bytes.
Only the
The simt_printf_fifo_size parameter specifies the FIFO buffer size available for Printf in an SIMT operator, in bytes. The value must be an integer multiple of 8. Otherwise, the API automatically rounds up the value to meet this requirement.
The default value of simt_printf_fifo_size is 2 MB, the minimum value is 1 MB, and the maximum value is 64 MB.
The following gives a configuration example:
{
  "simt_printf_fifo_size": 1048576
}
Example of SIMD Printf FIFO Size Configuration
This configuration is used to control the Printf FIFO buffer size available to SIMD operators on each Core, in bytes.
Only the
The simd_printf_fifo_size_per_core parameter specifies the FIFO buffer size available for Printf in an SIMD operator, in bytes. The value must be an integer multiple of 8. Otherwise, the API automatically rounds up the value to meet this requirement.
The default value of simd_printf_fifo_size_per_core is 32 KB, the minimum value is 1 KB, and the maximum value is 64 MB.
The following gives a configuration example:
{
  "simd_printf_fifo_size_per_core": 1048576
}
References
For the API call example, see Initialization.
More flexible APIs are also provided to enable Dump or Profiling. Unlike aclInit, these APIs can be called repeatedly in a process, allowing varied Dump/Profiling configurations with each call.
- To obtain dump data, see aclmdlInitDump, aclmdlSetDump, and aclmdlFinalizeDump. If dump data does not need to be written to a file, you can obtain the dump data by using a callback function. For details, see acldumpRegCallback.
- To obtain profiling data, see Profiling Data Collection.