Using APIs to Construct and Execute a Graph
The following figure shows the process of using APIs to construct and execute a graph.
Figure 1 Using FlowNode to construct and execute a graph
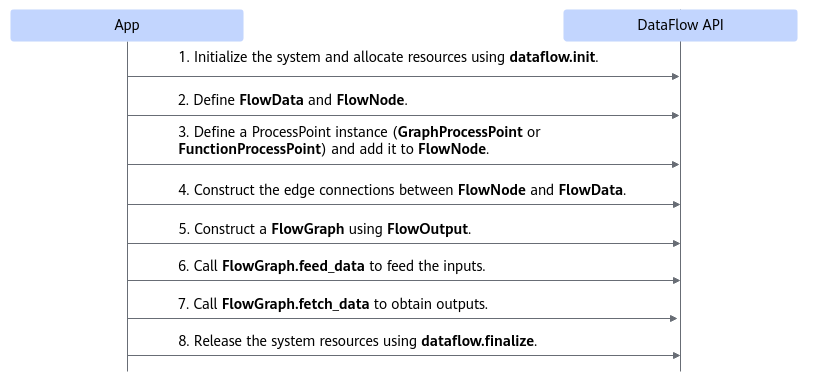
The sample code is as follows: For complete sample code, see sample_base.
1 2 3 4 5 6 7 8 9 10 11 12 13 14 15 16 17 18 19 20 21 22 23 24 25 26 27 28 29 30 31 32 33 34 35 | import dataflow as df import numpy as np # Initialize the system. options = { "ge.exec.deviceId":"0", "ge.experiment.data_flow_deploy_info_path":"./data_flow_deploy_info.json", "ge.socVersion": "AscendXXX" # Modify the version based on the environment. } df.init(options) # Define FlowData. data0 = df.FlowData() data1 = df.FlowData() # Define FuncProcessPoint to implement the Add function and add it to FlowNode. pp0 = df.FuncProcessPoint(compile_config_path='config/add_func.json') add_node = df.FlowNode(input_num=2, output_num=1) add_node.add_process_point(pp0) # Construct edge connections between FlowData and FlowNode. add_out = add_node(data0, data1) # Build a FlowGraph using FlowOut. dag = df.FlowGraph([add_out]) # Call FlowGraph.feed_data to feed inputs. flow_info = df.FlowInfo() dag.feed_data({data0:np.array([[1, 2]], dtype=np.int32), data1:np.array([[2, 3]], dtype=np.int32)}, flow_info) # Call FlowGraph.fetch_data to obtain outputs. print("dataflow fetch result:", dag.fetch_data()) # Release system resources. df.finalize() |
Parent topic: DataFlow Running