Locating Process Suspension Faults
You can perform the following steps to locate a fault. If the fault persists, contact technical support. After obtaining the logs, click here to contact technical support.
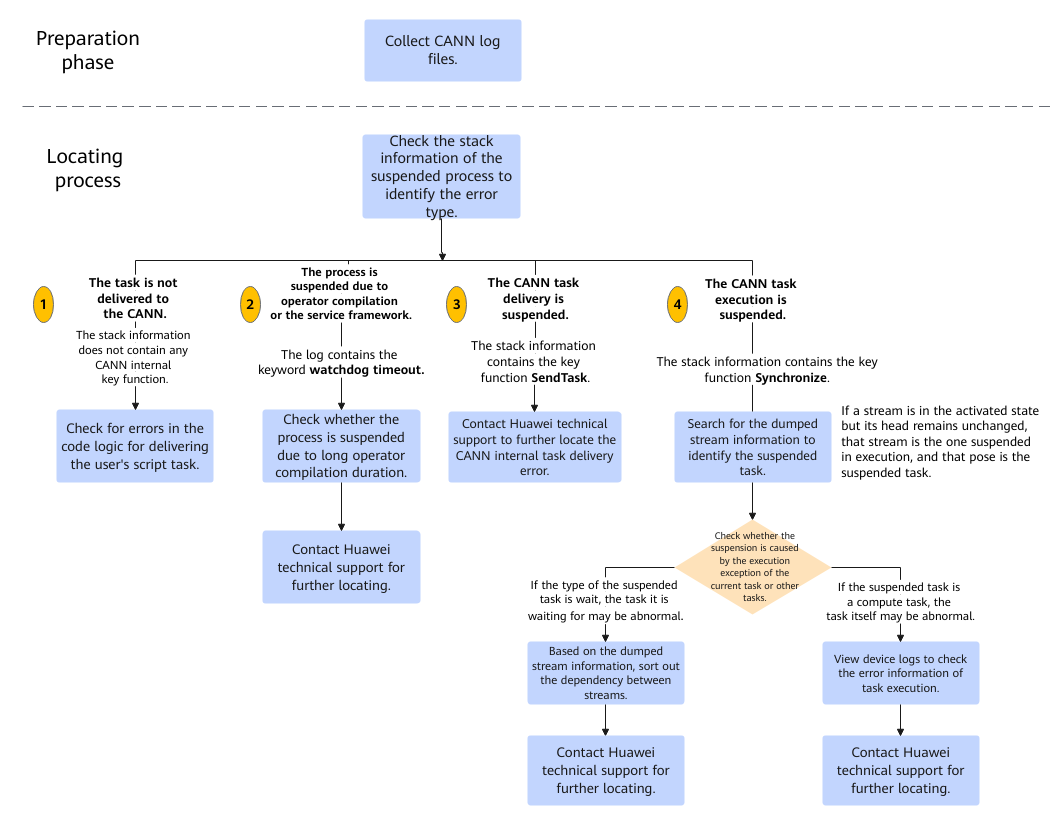
In the preparation phase, you need to collect CANN log files. For details about how to collect CANN log files, see Collect Information About Process Suspension. The following uses ${HOME}/err_log_info/ as an example of directory for storing collected logs.
The locating process is as follows:
- Use the asys tool to obtain the call stack information of the suspended process. In addition, check whether the online operator compilation of the framework takes a long time based on the plog run logs.The following is an example of the asys command. For details about how to install the asys tool and its parameters, see Environment Setup.
# pid indicates the ID of the suspended user process. Replace it with the actual ID.
asys collect -r=stacktrace --remote=pid --all --quiet
After the asys command is executed successfully, you can obtain the stack result file based on the stackcore file path message in the terminal window. If the GDB tool is used, you can also obtain the stack information by referring to Viewing the Stack of a C/C++ Application.
Based on the stack information and logs, the fault locating process is as follows:- If the stack information does not contain any CANN internal key function, the task is not delivered to the CANN. In this case, locate the problem of delivering the customer's script task.
The CANN internal functions come from the library files in the CANN software installation directory. The default CANN software installation directory is /usr/local/Ascend.
- If the plog run log contains the keyword watchdog timeout, the process is suspended because online compilation of the operator takes a long time. In this case, contact technical support to further locate the fault.
An example of a plog run log (${HOME}/err_log_info/log/run/plog/plog-pid _*.log) is as follows:
[INFO][pid:2241703][awatchdog_monitor.c:145](tid:2245407) watchdog timeout, dogId 65584, timeout : 3s
If the process exits due to timeout caused by long operator compilation duration, or the upper-layer service framework terminates the process, you can use trace logs to check whether the process is suspended due to long operator compilation duration.
# In the trace log directory, search for the log file that records the operator compilation information.
find <trace log directory > -name schedule_tracer_FE_Global_Trace.txt
find <trace log directory > -name schedule_tracer_FE_Statistics_Trace.txt
find <trace log directory > -name schedule_tracer_FE_CompileTd_*.txt
Keywords in trace logs are described as follows:
- schedule_tracer_FE_Global_Trace.txt is used to record global settings, status, and time points such as operator initialization and destruction, and cache aging.
If the log contains the keyword Compile process status., the operator is being compiled. If the log contains the keyword Finish subgraph compile, the operator compilation is complete. If an operator stays in the Compile process status. state, you need to check the processing phase of the operator based on the schedule_tracer_FE_CompileTd_*.txt log.
An example of the log segment is as follows:
atrace/trace_160081_160353_20240614161350257811/schedule_event_160353_20240614161504656402/schedule_tracer_FE_Global_Trace.txt
2024-06-14 16:13:53.548.098 Begin to initialize TeFusion.
2024-06-14 16:13:53.549.392 Dfx manager has been initialized.
2024-06-14 16:13:58.854.521 CannKb has been initialized.
2024-06-14 16:13:58.890.273 Multi process has been checked.
2024-06-14 16:13:58.892.068 Cache manager has been initialized.
2024-06-14 16:13:59.785.505 TbeCompiler has been initialized.
2024-06-14 16:14:00.399.061 Parallel Compilation has been initialized.
2024-06-14 16:14:00.399.368 PythonApiCall has been initialized.
2024-06-14 16:14:00.400.672 TeFusion has been initialized successfully.
2024-06-14 16:14:38.536.555 Compile process status. ThreadId:139857490806528|Total task count:1|Finished task count:1|Waiting task count:0
2024-06-14 16:14:38.536.718 ThreadId:139857490806528|SingleOp:Assign_2|Task wait second:12
2024-06-14 16:14:38.536.753 Finish subgraph compile. ThreadId:139857490806528|Total task count:1
2024-06-14 16:15:19.548.089 Compile process status. ThreadId:139857456973568|Total task count:6|Finished task count:2|Waiting task count:4
2024-06-14 16:15:19.548.229 ThreadId:139857456973568|SingleOp:Sub_18|Task wait second:14
2024-06-14 16:15:40.628.425 Compile process status. ThreadId:139857456973568|Total task count:6|Finished task count:4|Waiting task count:2
2024-06-14 16:15:40.628.583 ThreadId:139857456973568|SingleOp:GatherV2_10|Task wait second:6
2024-06-14 16:16:01.959.390 Compile process status. ThreadId:139857456973568|Total task count:6|Finished task count:6|Waiting task count:0
2024-06-14 16:16:01.959.541 ThreadId:139857456973568|SingleOp:Pow_16|Task wait second:7
2024-06-14 16:16:01.959.579 Finish subgraph compile. ThreadId:139857456973568|Total task count:6
2024-06-14 16:16:32.408.784 Compile process status. ThreadId:139857456973568|Total task count:2|Finished task count:2|Waiting task count:0
2024-06-14 16:16:32.408.943 ThreadId:139857456973568|SingleOp:Pow_2|Task wait second:12
2024-06-14 16:16:32.409.027 Finish subgraph compile. ThreadId:139857456973568|Total task count:2
2024-06-14 16:16:43.550.284 PreBuildManager has been finalized.
2024-06-14 16:16:43.550.286 Begin to finalize TeFusion.
2024-06-14 16:16:43.559.052 ParallelCompilation has been finalized.
2024-06-14 16:16:43.591.007 Files under kernel meta dir and kernel meta temp dir has been removed.
2024-06-14 16:16:43.808.544 CannKb has been finalized.
2024-06-14 16:16:43.808.737 Python object has been reset.
2024-06-14 16:16:43.823.564 TeFusion has been finalized successfully.
- schedule_tracer_FE_CompileTd_*.txt is used to record the status and change of the operators that are being compiled.
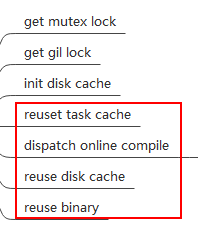
Generally, if the operator stays in the init disk cache state, the operator compilation is suspended. If the operator enters the reuse task cache, dispatch online compile, reuse disk cache, or reuse binary state, the operator compilation is in normal proceeding.
The following is an example of a log segment:
cat atrace/trace_160081_160353_20240614161350257811/schedule_event_160353_20240614161504666001/schedule_tracer_FE_CompileTd_8.txt
2024-06-14 16:14:35.340.781 Compile process detail:Thread Id:139857456973568|Op Id:10|Op Type:GatherV2|get mutex lock
2024-06-14 16:14:35.340.846 Compile process detail:Thread Id:139857456973568|Op Id:10|Op Type:GatherV2|get gil lock
2024-06-14 16:14:35.340.876 Compile process detail:Thread Id:139857456973568|Op Id:10|Op Type:GatherV2|init disk cache
2024-06-14 16:14:35.346.571 Compile process detail:Thread Id:139857456973568|Op Id:10|Op Type:GatherV2|dispatch online compile
......
2024-06-14 16:15:52.991.561 Compile process detail:Thread Id:139857456973568|Op Id:4|Op Type:Xdivy|get mutex lock
2024-06-14 16:15:52.991.674 Compile process detail:Thread Id:139857456973568|Op Id:4|Op Type:Xdivy|get gil lock
2024-06-14 16:15:52.991.706 Compile process detail:Thread Id:139857456973568|Op Id:4|Op Type:Xdivy|init disk cache
2024-06-14 16:15:52.996.765 Compile process detail:Thread Id:139857456973568|Op Id:4|Op Type:Xdivy|reuse binary
The status of each operator compilation phase is as follows:
- schedule_tracer_FE_Statistics_Trace.txt is used to record the compilation status of the entire operator. Some caches are not used or fail to be updated.
The following is an example of a log segment:
atrace/trace_160081_160353_20240614161350257811/schedule_event_160353_20240614161504656977/schedule_tracer_FE_Statistics_Trace.txt
2024-06-14 16:16:43.550.032 Disk cache statistics:match times:9|reuse fail times:9|copy times:8|copy success times:7|copy fail times:1
2024-06-14 16:16:43.550.043 Disk cache statistics:cache not existed times:9
2024-06-14 16:16:43.550.044 Online compile statistics:compile task submit times:7
2024-06-14 16:16:43.550.044 Binary reuse statistics:match times:9|reused times:3|reuse fail times:1|reuse check fail times:7
2024-06-14 16:16:43.550.044 Binary reuse statistics:simple key mismatch times:1
- schedule_tracer_FE_Global_Trace.txt is used to record global settings, status, and time points such as operator initialization and destruction, and cache aging.
- If the stack information contains the key function SendTask, the CANN task delivery is suspended. In this case, contact technical support to locate the code logic error of task delivery.
An example of the stack information fragment is as follows:
[stack]
Thread 1 (3491807)
#00 0x0000ffff32ccfd84 0x0000ffff32992000 /usr/local/Ascend/8.3.RC1/aarch64-linux/lib64/libruntime_v100.so (_ZN3cce7runtime16DirectHwtsEngine11TaskReclaimEjbRj)
#01 0x0000ffff32ccdedc 0x0000ffff32992000 /usr/local/Ascend/8.3.RC1/aarch64-linux/lib64/libruntime_v100.so (_ZN3cce7runtime16DirectHwtsEngine11SendingWaitEPNS0_6StreamERh)
#02 0x0000ffff32bf30e8 0x0000ffff32992000 /usr/local/Ascend/8.3.RC1/aarch64-linux/lib64/libruntime_v100.so (_ZN3cce7runtime6Engine8SendTaskEPNS0_15tagTaskInfoStruERtPj)
#03 0x0000ffff32cce49c 0x0000ffff32992000 /usr/local/Ascend/8.3.RC1/aarch64-linux/lib64/libruntime_v100.so (_ZN3cce7runtime16DirectHwtsEngine10SubmitSendEPNS0_15tagTaskInfoStruEPj)
#04 0x0000ffff32bf3ec8 0x0000ffff32992000 /usr/local/Ascend/8.3.RC1/aarch64-linux/lib64/libruntime_v100.so (_ZN3cce7runtime6Engine16SubmitTaskNormalEPNS0_15tagTaskInfoStruEPj)
#05 0x0000ffff32bf4d28 0x0000ffff32992000 /usr/local/Ascend/8.3.RC1/aarch64-linux/lib64/libruntime_v100.so (_ZN3cce7runtime6Engine10SubmitTaskEPNS0_15tagTaskInfoStruEPji)
- If the stack information contains the key function Synchronize, the task is suspended in the task execution phase. Go to 2 to continue tracing the suspended task.
An example of the stack information fragment is as follows:
[stack]
Thread 1 (332418, rtstest_host)
#00 0x00007fe235f255cb 0x00007fe235e11000 /usr/lib/x86_64-linux-gnu/libc-2.31.so (ioctl)
#01 0x00007fe1f06456f5 0x00007fe1f0570000 /usr/local/Ascend/driver/lib64/driver/libascend_hal.so (trs_dev_ioctl)
#02 0x00007fe1e9bcc5ca 0x00007fe1e97b3000 /usr/local/Ascend/8.5.0/x86_64-linux/lib64/libruntime_v200.so (_ZN3cce7runtime9NpuDriver15LogicCqReportV2ERKNS0_15LogicCqWaitInfoEPhjRj)
#03 0x00007fe1e9b2a417 0x00007fe1e97b3000 /usr/local/Ascend/8.5.0/x86_64-linux/lib64/libruntime_v200.so (_ZN3cce7runtime8SyncTaskEPNS0_6StreamEji)
#04 0x00007fe1e9b28ae7 0x00007fe1e97b3000 /usr/local/Ascend/8.5.0/x86_64-linux/lib64/libruntime_v200.so (_ZN3cce7runtime18SubmitTaskPostProcEPNS0_6StreamEjbi)
#05 0x00007fe1e9ad849d 0x00007fe1e97b3000 /usr/local/Ascend/8.5.0/x86_64-linux/lib64/libruntime_v200.so (_ZN3cce7runtime20ProcStreamRecordTaskEPNS0_6StreamEi)
#06 0x00007fe1e9b68fc6 0x00007fe1e97b3000 /usr/local/Ascend/8.5.0/x86_64-linux/lib64/libruntime_v200.so (_ZN3cce7runtime11DavidStream16SubmitRecordTaskEi)
#07 0x00007fe1e9b4c723 0x00007fe1e97b3000 /usr/local/Ascend/8.5.0/x86_64-linux/lib64/libruntime_v200.so (_ZN3cce7runtime6Stream16StarsWaitForTaskEjbi)
#08 0x00007fe1e9b550f2 0x00007fe1e97b3000 /usr/local/Ascend/8.5.0/x86_64-linux/lib64/libruntime_v200.so (_ZN3cce7runtime6Stream11SynchronizeEbi)
#09 0x00007fe1e9982895 0x00007fe1e97b3000 /usr/local/Ascend/8.5.0/x86_64-linux/lib64/libruntime_v200.so (_ZN3cce7runtime7ApiImpl17StreamSynchronizeEPNS0_6StreamEi)
- If the stack information does not contain any CANN internal key function, the task is not delivered to the CANN. In this case, locate the problem of delivering the customer's script task.
- View the logs, find the suspended stream, and determine the suspended task.
- Check the information of the stream where the error is reported based on the collected trace logs.
The following is an example of the error information in the trace log (schedule_tracer_*.txt file):
[ERROR] TSCH(-1,null):2024-02-08-01:41:14.977.406 3986 (dieid:0,cpuid:0) stars_timewheel.c:90 stars_wait_sqe_is_timeout: Timeout: sq_pid=80029, sq_id=3, is_need_process=1, exe_time=16, time_out=10, stream_id=3, task_id=47, cur_head=47, wait_sqe_head=47.
[ERROR] TSCH(-1,null):2024-02-08-01:41:14.977.431 3987 (dieid:0,cpuid:0) stars_interrupt.c:1221 stars_proc_wait_timeout: wait task timeout, rtsq_id=3, type=5, sq_pid=80029
- In the trace log (schedule_tracer_*.txt file), search for the dumped stream information based on stream_id. For example, run the grep -rn "stream_id=3" command to search for the keyword.
The log example and parsing are as follows:
- The sq_en status of stream 3 is 1, indicating that the stream is activated.
- head is used to identify the task that is being executed on the stream. If value of head is 47, the task execution stays on task 47.
- pos indicates the task to be executed. Because the task execution stays on task 47, pos[47] is the suspended task.
################################################################
stream_id=3, rtsq_id=3, sq_fsm=0x9, cur_wait_time=16, head=47, tail=49, is_model=0, model_id=65535, exe_times=65535, sq_en=1, swap_in=0, cq_head=10, cq_tail=10, pid=80029, vf_id=0, is_mc2_sq=0
stream_id=3, overflow_en=0, ge_op_tag=4294967295, has_overflow=0
swapbuff[0] 0x 59080000 0000001f 000d001f 00030201 00000000 0001389d 010007ff 00000000
swapbuff[8] 0x 3e5c8000 00000007 000107ff 00000000 00000000 0000d555 00000052 00000000
sqe[0] 0x 00004003 00278003 0000ffff 00fe0000 00000000 00000000 00000000 00000000
sqe[8] 0x 00000000 00000000 00000000 00000000 00000000 00000000 00000000 00000000
pos=39: stream_id=32771, task_id=39, sqe_type=3, post_p=0
sqe[0] 0x 00010000 00280003 00001000 00fe0000 40400000 00001241 00000000 00000004
sqe[8] 0x c00197c0 00001240 8000a000 00001241 00000000 00000000 00000000 00000000
pos=40: stream_id=3, task_id=40, sqe_type=0, FFTS
sqe[0] 0x 00000004 00290003 00000008 00fe0000 00000000 00000000 00000000 00000000
sqe[8] 0x 00000000 00000000 00000000 00000000 00000000 00000000 00000000 00000000
pos=41: stream_id=3, task_id=41, sqe_type=4, Event Record, event_id=8, isSync=0
sqe[0] 0x 00010000 002a0003 00001000 00fe0000 40400000 00001241 00000000 00000004
sqe[8] 0x c00197c0 00001240 8000a800 00001241 00000000 00000000 00000000 00000000
pos=42: stream_id=3, task_id=42, sqe_type=0, FFTS
sqe[0] 0x 00000005 002b0003 00000009 00ff0000 00000000 0000000a 00000000 00000000
sqe[8] 0x 00000000 00000000 00000000 00000000 00000000 00000000 00000000 00000000
pos=43: stream_id=3, task_id=43, sqe_type=5, Event Wait, event_id=9
sqe[0] 0x 00010000 002c0003 00001000 00fe0000 40400000 00001241 00000000 00000004
sqe[8] 0x c00197c0 00001240 8000b000 00001241 00000000 00000000 00000000 00000000
pos=44: stream_id=3, task_id=44, sqe_type=0, FFTS
sqe[0] 0x 00010000 002d0003 00001000 00fe0000 40400000 00001241 00000000 00000004
sqe[8] 0x c00197c0 00001240 8000b400 00001241 00000000 00000000 00000000 00000000
pos=45: stream_id=3, task_id=45, sqe_type=0, FFTS
sqe[0] 0x 00010000 002e0003 00001000 00fe0000 40400000 00001241 00000000 00000004
sqe[8] 0x c00197c0 00001240 8000b800 00001241 00000000 00000000 00000000 00000000
pos=46: stream_id=3, task_id=46, sqe_type=0, FFTS
sqe[0] 0x 00000005 002f0003 0000000b 00ff0000 00000000 0000000a 00000000 00000000
sqe[8] 0x 00000000 00000000 00000000 00000000 00000000 00000000 00000000 00000000
pos=47: stream_id=3, task_id=47, sqe_type=5, Event Wait, event_id=1
sqe[0] 0x 00004003 00308003 0000ffff 00fe0000 00000000 00000000 00000000 00000000
sqe[8] 0x 00000000 00000000 00000000 00000000 00000000 00000000 00000000 00000000
pos=48: stream_id=32771, task_id=48, sqe_type=3, post_p=0
################################################################
- Check whether the suspension is caused by the execution exception of the current task or other tasks.
- If the type of the suspended task is wait (the log contains the keyword Event Wait and event_id is printed in the log), the task is waiting for the execution result of another task. The execution of the other task may be abnormal. In this case, go to 2.d to locate the fault.
- If the type of the task is not Wait, the task may be a computing task. In this case, contact technical support to further locate the fault.
- Sort out the dependency between streams and locate the cause of task suspension.
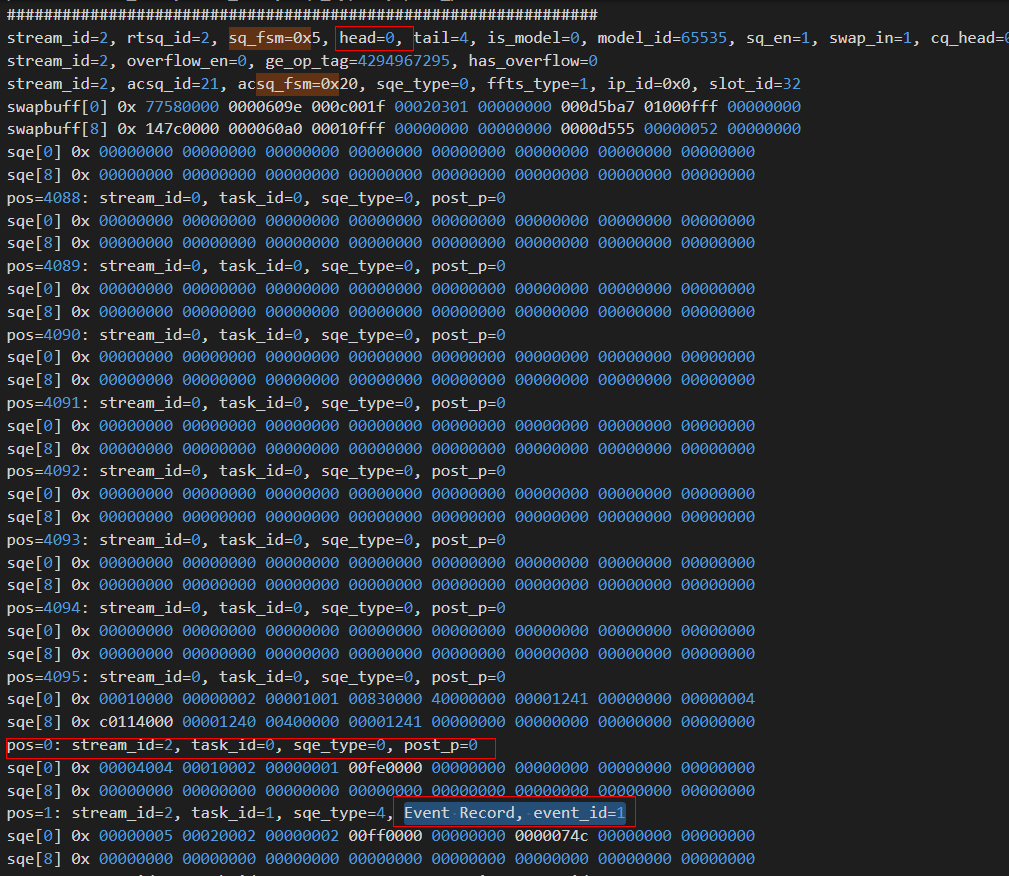
In the trace log (schedule_tracer_*.txt file), use event_id. For example, run the grep -rn "event_id=1" command to search for the keyword and find the flow that delivers the Event Record task. The record task of the flow is not executed. As a result, the event wait task of another flow is suspended. After locating the cause of the task suspension, contact technical support to further check the software or user invoking logic.
The log example and parsing are as follows: Find stream 2 where the corresponding event_record task is located based on event_id=1. The log information shows that the task execution on stream 2 is suspended at task 0 (pos[0] task) and the event_record task (pos[1]) of the stream 2 is not executed. As a result, other streams are suspended.
- Check the information of the stream where the error is reported based on the collected trace logs.