Locating Process Interruption Faults
You can perform the following steps to locate a fault. If the fault persists, contact technical support. After obtaining the logs, click here to contact technical support.
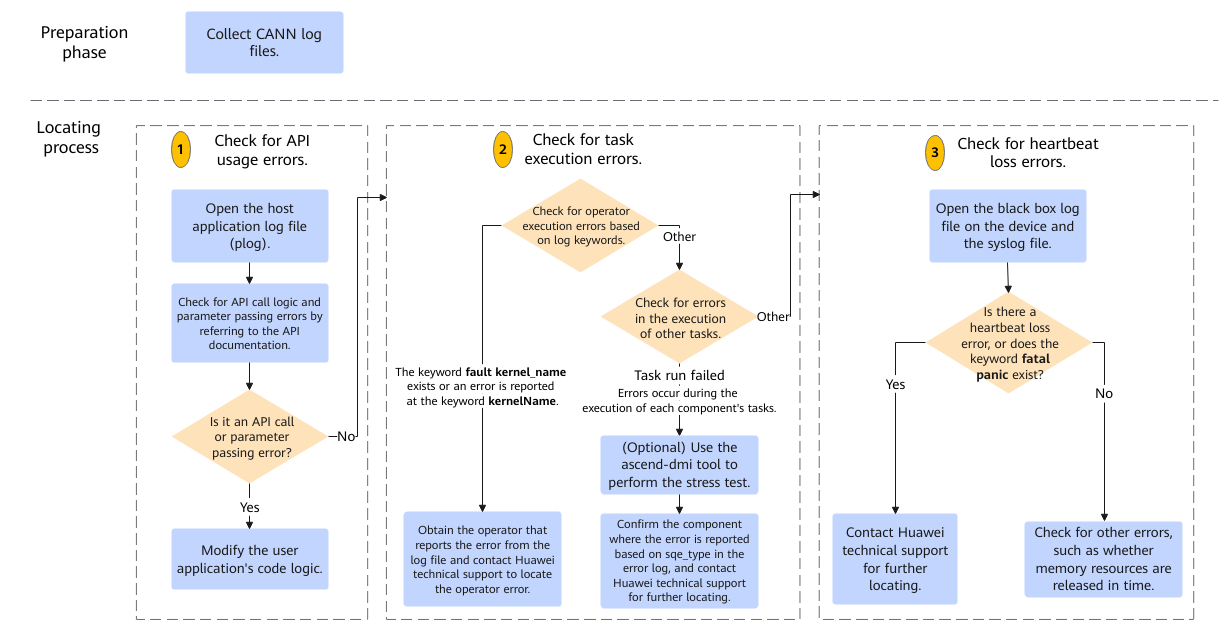
In the preparation phase, you need to collect CANN log files. For details about how to collect CANN log files (including application logs and on-device system logs), see Collect Information About Process Interruption. The following uses ${HOME}/err_log_info/ as an example of directory for storing collected logs.
The locating process is as follows:
In the host application log file ${HOME}/err_log_info/log/[run|debug]/plog/plog-pid_*.log, run the grep -rn "ERROR" command. If the first reported error contains an error code (except E*9*** errors, which are internal system error codes), rectify the fault by referring to the solution in Error Code Reference. If the fault persists, contact technical support. If the first reported error does not contain an error code, go to the next step.
- Check for API usage errors.
In the host application log file ${HOME}/err_log_info/log/[run|debug]/plog/plog-pid_*.log collected, check whether the logs generated around the time when the process interruption occurs contain interface errors such as acl***, [drv api], and rt***. If the logs do not contain interface errors, go to 2. If an error is reported for an external interface (generally, starting with acl), check the interface usage description and parameter description in the corresponding API reference. For other internal interface errors, contact technical support for further fault locating. For details about typical error cases, see No Context Is Available Due to an Error in Invoking the SetDevice Interface and Reported error in rtMemcpyAsync asynchronous parameter verification.
- Check for task execution errors.Perform this step to check for operator execution errors and then check for other task execution errors. If a task execution error is reported, provide the error information and contact technical support for further locating. If no task execution error is reported, go to 3.
- In the host application log file ${HOME}/err_log_info/log/[run|debug]/plog/plog-pid_*.log, run the grep -rn "fault kernel_name" or grep -rn "kernelName" command to search for the keyword. If the keyword fault kernel_name exists and is the first error or an error is reported at the keyword kernelName, an error occurs during operator execution. In this case, obtain the kernel name where the error is reported and contact technical support for further locating.
- The following is an example of the log where the first error message fault kernel_name is displayed:
[ERROR] RUNTIME(539029,python3):2024-03-25-11:22:02.462.276 [stream.cc:1509]539029 GetError:[INIT][DEFAULT]Stream Synchronize failed, stream_id=2, retCode=0x31, [vector core exception].
[ERROR] RUNTIME(539029,python3):2024-03-25-11:22:02.462.315 [stream.cc:1512]539029 GetError:[INIT][DEFAULT]report error module_type=5, module_name=EZ9999
[ERROR] RUNTIME(539029,python3):2024-03-25-11:22:02.462.346 [stream.cc:1512]539029 GetError:[INIT][DEFAULT]Aicore kernel execute failed, device_id=0, stream_id=2, report_stream_id=2, task_id=1, flip_num=0, fault kernel_name=Add_ee98c6628030785f610b924ab1557b31_high_performance_210000000, fault kernel info ext=none, program id=0, hash=11042444066001143980.
[INFO] GE(539029,python3):2024-03-25-11:22:02.462.391 [error_manager.cc:306]539029 ReportInterErrMessage:report error_message, error_code:EZ9999, work_stream_id:53903439029, error_mode:0
[ERROR] RUNTIME(539029,python3):2024-03-25-11:22:02.462.626 [stream.cc:1512]539029 GetError:[INIT][DEFAULT]report error module_type=5, module_name=EZ9999
[ERROR] RUNTIME(539029,python3):2024-03-25-11:22:02.462.650 [stream.cc:1512]539029 GetError:[INIT][DEFAULT][AIC_INFO] after execute:args print end
[INFO] GE(539029,python3):2024-03-25-11:22:02.462.677 [error_manager.cc:306]539029 ReportInterErrMessage:report error_message, error_code:EZ9999, work_stream_id:53903439029, error_mode:0
[ERROR] RUNTIME(539029,python3):2024-03-25-11:22:02.462.840 [logger.cc:488]539029 StreamSynchronize:[INIT][DEFAULT]Stream synchronize failed, stream_id=2
[ERROR] RUNTIME(539029,python3):2024-03-25-11:22:02.462.883 [api_c.cc:782]539029 rtStreamSynchronize:[INIT][DEFAULT]ErrCode=507035, desc=[vector core exception], InnerCode=0x715005e
[ERROR] RUNTIME(539029,python3):2024-03-25-11:22:02.462.913 [error_message_manage.cc:53]539029 FuncErrorReason:[INIT][DEFAULT]report error module_type=3, module_name=EE8888
- The following is an example of the log containing the keyword kernelName:
[ERROR] RUNTIME(3280125,python3):2023-12-11-11:42:58.805.278 [task_info.cc:8323]3280125 DoCompIeteSuccForFftspIusTask:[LOAD][LOAD]fftsplus report error, retcode=0x10f,  [fftsplus task exception].
[ERROR] RUNTIME(3280125,python3):2023-12-11-11:42:58.805.293 [stream.cc:1463]3280125 GetError:[LOAD][LOAD]Stream Synchronize failed,  stream_id = 2,  retcode=0x10f,  [fftsplus task exception].
[ERROR] RUNTIME(3280125,python3):2023-12-11-11:42:58.805.409 [task_info.cc:8196]3280125 PrintAicAivErrorInfoForFftsPlusTask:[LOAD][LOAD]fftsplus task execute failed,  dev_id=0, stream_id=2, task_id=1948, context_id=0, thread_id=0,  err_type=11[fftsplus aicore error], pcStart=0x124dbce99914, kernelName:IncreFlashAttetion_b79da629624fb10fa525b749f186c95f_high_performance_18_mix_aic
[ERROR] RUNTIME(3280125,python3):2023-12-11-11:42:58.805.476 [task_info.cc:8196]3280125 TaskFailCallBackForFftsPlusTask:[LOAD][LOAD]fftsplus streamId=2, taskId=1948, context_id=0, expandtype=1, rtCode=0x715006c,[fftsplus task exception]
[ERROR] RUNTIME(3280125,python3):2023-12-11-11:42:58.805.551 [engine.cc:3890]3280125 StarsResumeRtsq:[LOAD][LOAD]stop scheduling in abort failure mode: stream_id=2, sq_id=2, sq_head=1948, task_id=1948, taskType=52.
[TRACE] GE(3280125,python3):2023-12-11-11:42:58.833.094 [status:STOP] [ge_api.cc:851]3280125 RunGraphWithStreamAsync:Session run graph with stream async finished.
[ERROR] RUNTIME(3280125,python3):2023-12-11-11:42:58.841.081 [stream.cc:1463]3280125 GetError:[LOAD][LOAD]Stream Synchronize failed, stream_id=2, retCode=0x10f, [fftsplus task exception].
[ERROR] RUNTIME(3280125,python3):2023-12-11-11:42:58.841.113 [stream.cc:1466]3280125 GetError:[LOAD][LOAD]report error module_type=7, module_name=EE9999
[ERROR] RUNTIME(3280125,python3):2023-12-11-11:42:58.841.126 [stream.cc:1466]3280125 GetError:[LOAD][LOAD]fftsplus task execute failed, dev_id=0, stream_id=2, task_id=1948, context_id=0, thread_id=0.
- The following is an example of the log where the first error message fault kernel_name is displayed:
- In the host application log file ${HOME}/err_log_info/log/[run|debug]/plog/plog-pid_*.log, if the keyword Task run failed exists and is the first error, an error occurs for the CANN internal component execution task.
In this case, you can use the fault diagnosis function of the ascend-dmi tool to perform the stress test, provide the stress test report and error logs, and contact technical support for further locating. If the stress test environment is unavailable, you can also provide error logs and contact technical support. The technical support can determine whether to perform the stress test after further locating faults. The ascend-dmi tool is contained in the MindCluster ToolBox software package. For details about the mapping between the software and CANN, click here. For details about how to install and use the ascend-dmi tool, click here.
sqe_type in the error log indicates the component or module where the error is reported. If sqe_type in the first error is notify wait, check whether the error is reported by an operator in the model. View the error in the following plog and search for fault kernel_name to find the operator that reports the error.
An example of the error log is as follows:
[ERROR]  RUNTIME(2237671,python3) :2024-01-02-11:47:51.222.069 [ engine.CC:4057 ]2479231 ProcLogicCqReport:[EXEC][EXEC]Task run failed, device_id=5,  stream_id=6,  task_id=73, sqe_type=0(ffts), errType=0x1(task exception), sqSwStatus=0
[ERROR]  RUNTIME(2237671,python3) :2024-01-02-11:47:52.260.748 [device_error_proc.cc:1166]2479231 ProcessStarsCoreErrorInfo:[EXEC][EXEC]report error module_type=5, module_name=EZ9999
[ERROR]  RUNTIME(2237671,python3) :2024-01-02-11:47:52.260.832 [device_error_proc.cc:1166]2479231 ProcessStarsCoreErrorInfo:[EXEC][EXEC]The error from device(chipId:5, dieId:0), serial number is 4, there is an aivec error exception, core id is 4, error code = 0x800000, dump info: pc start: 0x1240c144412c, current: 0x1240c1444210, vec error infor 0x5104540702, mte error info: 0x1003000072, ifu error info: 0x4289505b1ac00, ccu error info: 0x172d1b826001020, cube error info: 0, biu error info:0, aic error mask: 0x6500020bd000288, para base: 0x124100043000.
[ERROR]  RUNTIME(2237671,python3) :2024-01-02-11:47:52.260.911 [device_error_proc.cc:1178]2479231 ProcessStarsCoreErrorInfo:[EXEC][EXEC]report error module_type=5, module_name=EZ9999
[ERROR]  RUNTIME(2237671,python3) :2024-01-02-11:47:52.260.922 [device_error_proc.cc:1178]2479231 ProcessStarsCoreErrorInfo:[EXEC][EXEC]The extend info: errorcode:(0x800000, 0, 0) errorStr: The DDR address of the MTE instruction is out of range. fixp_error0 info: 0x3000072, fixp_error1: 0x10 fsmId:0, tslot:0, thread:0, ctxid:0, blk:0, sublk:0, subErrType:4
- In the host application log file ${HOME}/err_log_info/log/[run|debug]/plog/plog-pid_*.log, run the grep -rn "fault kernel_name" or grep -rn "kernelName" command to search for the keyword. If the keyword fault kernel_name exists and is the first error or an error is reported at the keyword kernelName, an error occurs during operator execution. In this case, obtain the kernel name where the error is reported and contact technical support for further locating.
- Rectify the heartbeat loss fault.
- If the host application log file ${HOME}/err_log_info/log/[run|debug]/plog/plog-pid_*.log contains the keyword Device lost heartbeat and the black box log file history.log (in the ${HOME}/err_log_info/report/*/hisi_logs directory) on the device contains the keyword HEARTBEAT EXCEPTION, the TaskScheduler CPU heartbeat is lost. In this case, contact technical support for further fault locating.
- If the syslog file (in the ${HOME}/err_log_info/report/*/message directory) on the device contains the keyword fatal panic, the control CPU heartbeat is lost. In this case, contact technical support for further fault locating.
- In the host application log file ${HOME}/err_log_info/log/[run|debug]/plog/plog-pid_*.log, if the keyword RESOURCE_ALLOC_FAIL exists, the error that resources are not released occurs. In this case, check the code logic of the application and release the resources in a timely manner after the resources such as memory are used.