os_runtime_statistic (Host-Side syscall and pthreadcall)
The timeline information of host-side syscall and pthreadcall data is displayed at the OS Runtime API level in the msprof_*.json file. The summary information is summarized in the os_runtime_statistic_*.csv file.
Applicable Products
Product |
Supported |
|---|---|
√ |
|
√ |
|
√ |
|
√ |
|
√ |
|
√ |
Data at OS Runtime API Layer in msprof_*.json
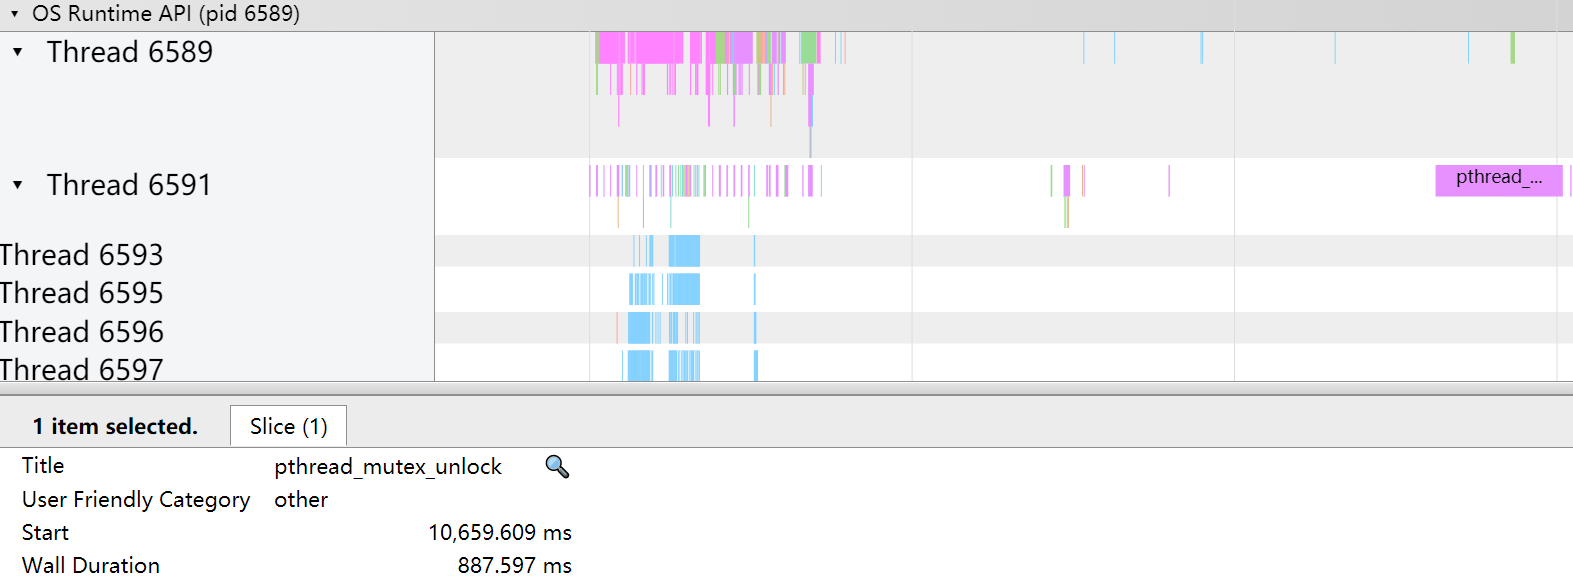
The following figure shows data at the OS Runtime API level in the msprof_*.json file.
Field |
Description |
|---|---|
Title |
API name of a component. As shown in the figure, pthread_mutex_unlock is selected. |
Start |
Start point on the timeline, which is automatically aligned with that in chrome trace (ms). |
Wall Duration |
Time taken by the calls to an API (ms). |
os_runtime_statistic_*.csv File
The file content is formatted as follows.

Field |
Description |
|---|---|
Device_id |
Device ID. host is displayed for data on the host. |
Process ID |
Process ID. |
Thread ID |
Thread ID. |
Name |
API name. |
Time(%) |
Percentage of time taken by the calls to an API. |
Time(us) |
Total time taken by the calls to an API, in μs. |
Count |
Number of calls to an API. |
Avg(us), Max(us), Min(us) |
Average, maximum, and minimum duration of the calls to an API, in μs. |