Inference Tuning Case
Case Overview
This section describes a recommended model inference scenario. Through complete code examples and profile data in the inference phase, this section analyzes and locates key bottlenecks that affect the model throughput performance, and provides corresponding optimization policies. This section describes the implementation methods of technologies such as multi-instance parallelism, AI Core control policy, and batch host-to-device (H2D) transmission, and the impact of these technologies on the inference throughput performance.
- AI Core control: The ge.aicoreNum parameter in Operator and Graph Build is used to configure the number of AI Cores used for operator building.
- Batch H2D: The aclrtMemcpyBatch API is called to implement batch memory copy.
- Multi-instance parallelism: Multiple inference instances are created using multiple threads to improve the concurrent processing capability of the system.
In this case, to evaluate the impact of different features on the inference throughput performance, 10,000 inference tasks are executed (constructed random values are used as the input data of the model in this case). The duration of a single inference task and total latency are recorded, and the model throughput (TPS) and average latency (ms) are calculated.
The following table lists the throughput and latency values of the
|
Configuration Scheme |
BatchSize=128 |
BatchSize=256 |
|---|---|---|
|
Single instance |
745,55 TPS / 1.471ms |
132,247 TPS / 1.685ms |
|
Single instance + batch H2D |
131,191 TPS / 0.792ms |
209,927 TPS / 1.030ms |
|
Multi-instance parallelism (4) |
155,104 TPS / 2.089ms |
360,253 TPS / 2.034ms |
|
Multi-instance parallelism (4) + AI Core control (16|16) |
185,415 TPS / 1.797ms |
384,163 TPS / 1.850ms |
|
Multi-instance parallelism (4) + AI Core control (16|16)+batch H2D |
251,877 TPS / 1.285ms |
493,065 TPS / 1.317ms |
- Taking the BatchSize=128 of a single instance as the benchmark, the preceding table shows that:
- Batch H2D can significantly reduce the data transfer overhead. In the single-instance scenario, the throughput is improved by 75.9% and the latency is reduced by 52.9%.
- Multi-instance parallelism increases the throughput to 2.08 times that of a single instance, but the latency increases by 41.7%.
- Taking the BatchSize=128 of multiple instances as the benchmark, the preceding table shows that:
AI Core control effectively avoids resource contention during multi-instance parallelism, improving the throughput by 19.5% and reducing the latency by 13.9%.
- Taking the BatchSize=128 of Multi-instance parallelism (4), AI Core control (16|16), and batch H2D as the benchmark, the preceding table shows that:
Increasing BatchSize significantly improves the scheduling density. When the BatchSize is 256, the throughput increases by 95.7% and the latency increases by 7.9%.
This feature is only supported by the following products:
Bottleneck Analysis
Table 1 shows the configuration of the baseline case, where a single instance is used, AI Core control is not used, and batch H2D transmission is disabled. Enable profiling by referring to Profile Data Collection.
|
Number of Inference Times |
BatchSize |
Multi-instance Parallelism |
AI Core Control |
Batch H2D |
|---|---|---|---|---|
|
10,000 |
128 |
1 |
The number of available cores is not controlled. |
Disabled |
- Data movement bottlenecks
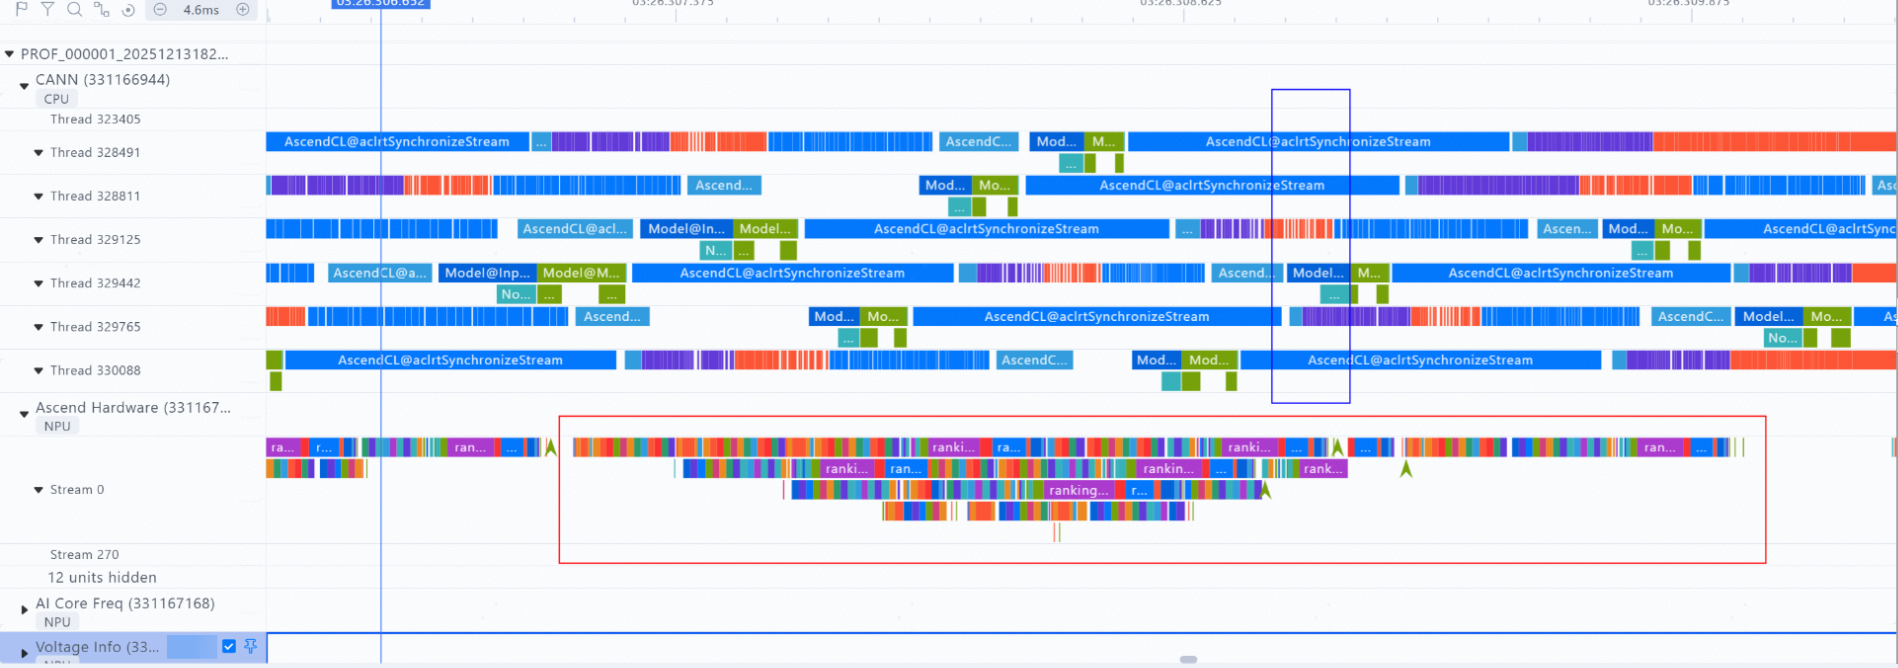
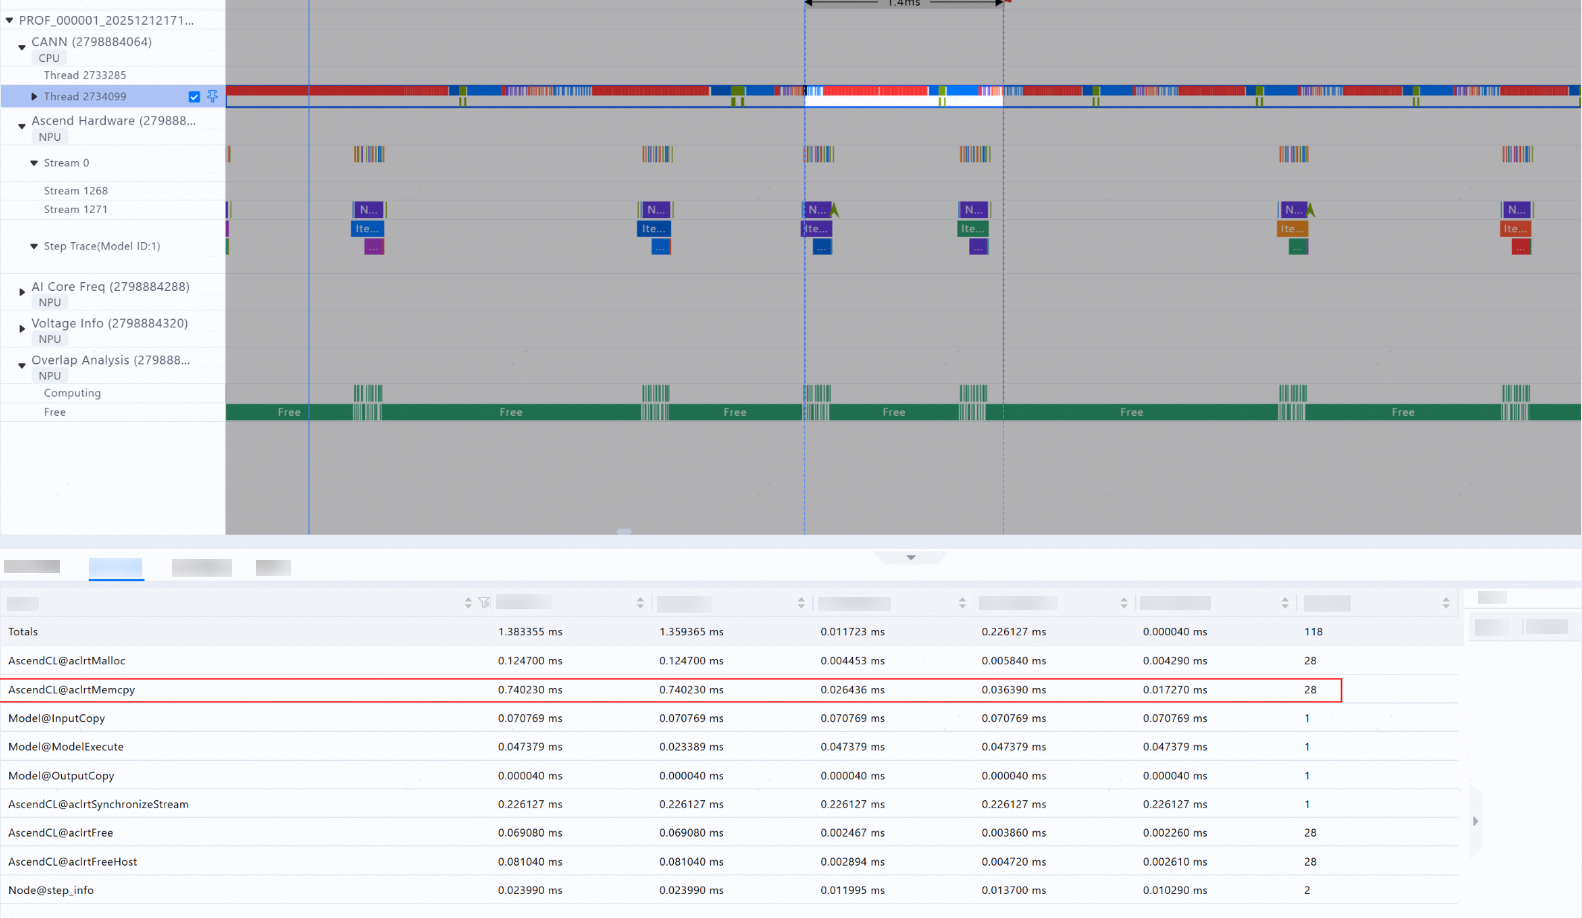
According to the profile data analysis, 28 independent H2D data movements need to be performed before a single inference. As a result, the NPU is idle in the data preparation phase, and the overall data movement time accounts for a large proportion (53.6%, 0.740230/1.383355). For details, see Figure 1.
- Insufficient kernel granularity and operator scheduling gap
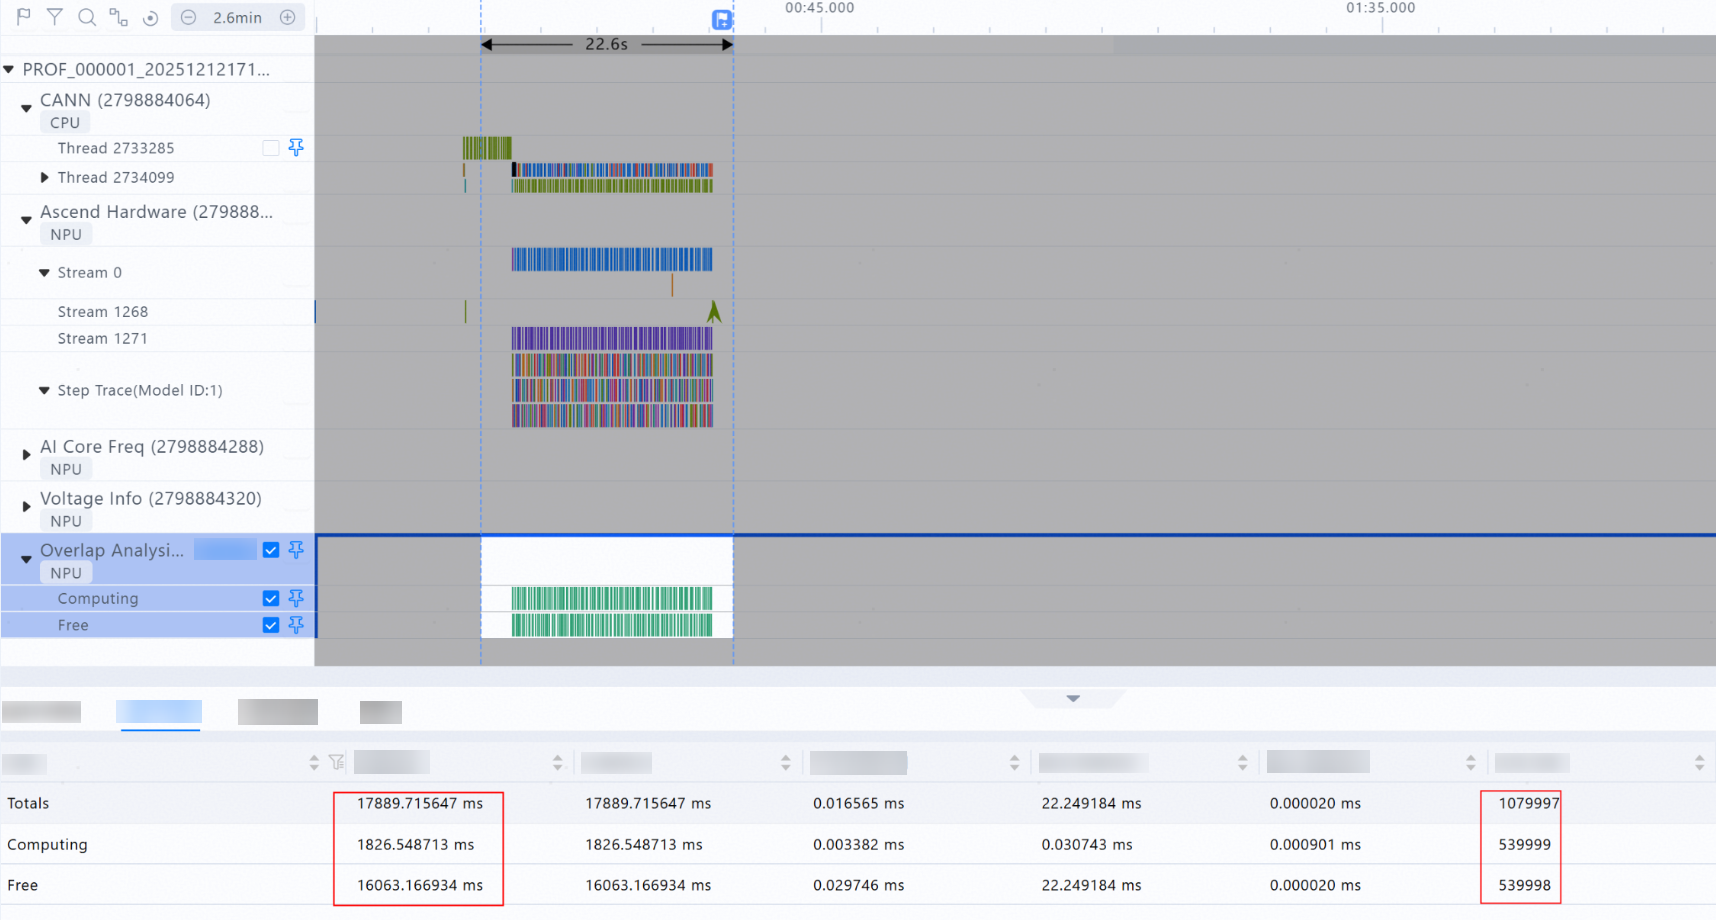
The operator execution time is short (1 μs to 5 μs), and operators depend on each other. As a result, bubbles (occurrence times: 539,998) are generated during operator execution on the NPU, and the resource utilization is low (10%, calculation time/total time = 1826.548713/17889.715647). For details, see Figure 3.
Figure 2 Operator execution time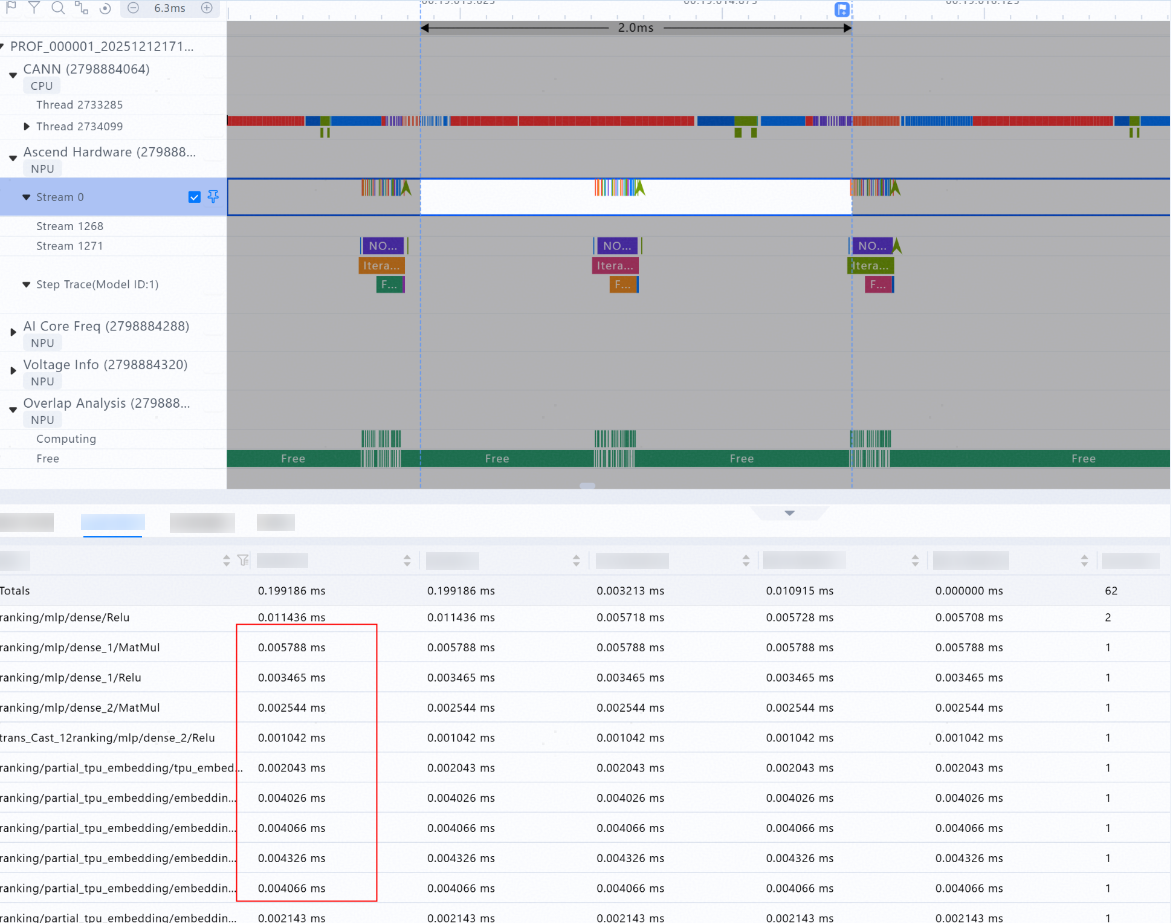
Optimization Solution
- Multi-instance parallelism
Execute inference tasks in a multi-thread interleaving manner to fill bubbles between operators and improve NPU utilization. However, this may lead to resource contention and increase the inference latency. Therefore, the degree of parallelism should be properly controlled to avoid excessive resource contention.
- Batch H2D optimization
Enable batch data movement to combine multiple data inputs into a single H2D operation, reducing the number of data movements and increasing the amount of data moved at a time.
- AI Core resource control
Configure the ge.aicoreNum parameter to limit the number of AI Cores that can be used by a single operator (for example, 8|8) to balance resource allocation, improve parallelism, and avoid excessive contention in multi-instance scenarios.
- Batch size increase
Increase the batch size for a single inference to improve the operator granularity and scheduling density, and reduce the proportion of scheduling overheads.
The following describes how to verify the inference effect in the scenario where batch H2D is enabled, multiple instances are used in parallel, and AI Core control is configured.
Optimization Solution Verification
Table 2 shows the configuration in this scenario, where multiple instances are used in parallel, AI Core control is configured, and batch H2D transmission is enabled. Enable profiling by referring to Profile Data Collection.
|
Number of Inference Times |
BatchSize |
Multi-instance Parallelism |
AI Core Control |
Batch H2D |
|---|---|---|---|---|
|
10,000 |
5,096 |
6 |
8|8 |
true |
The verification result is as follows:
- Data movement
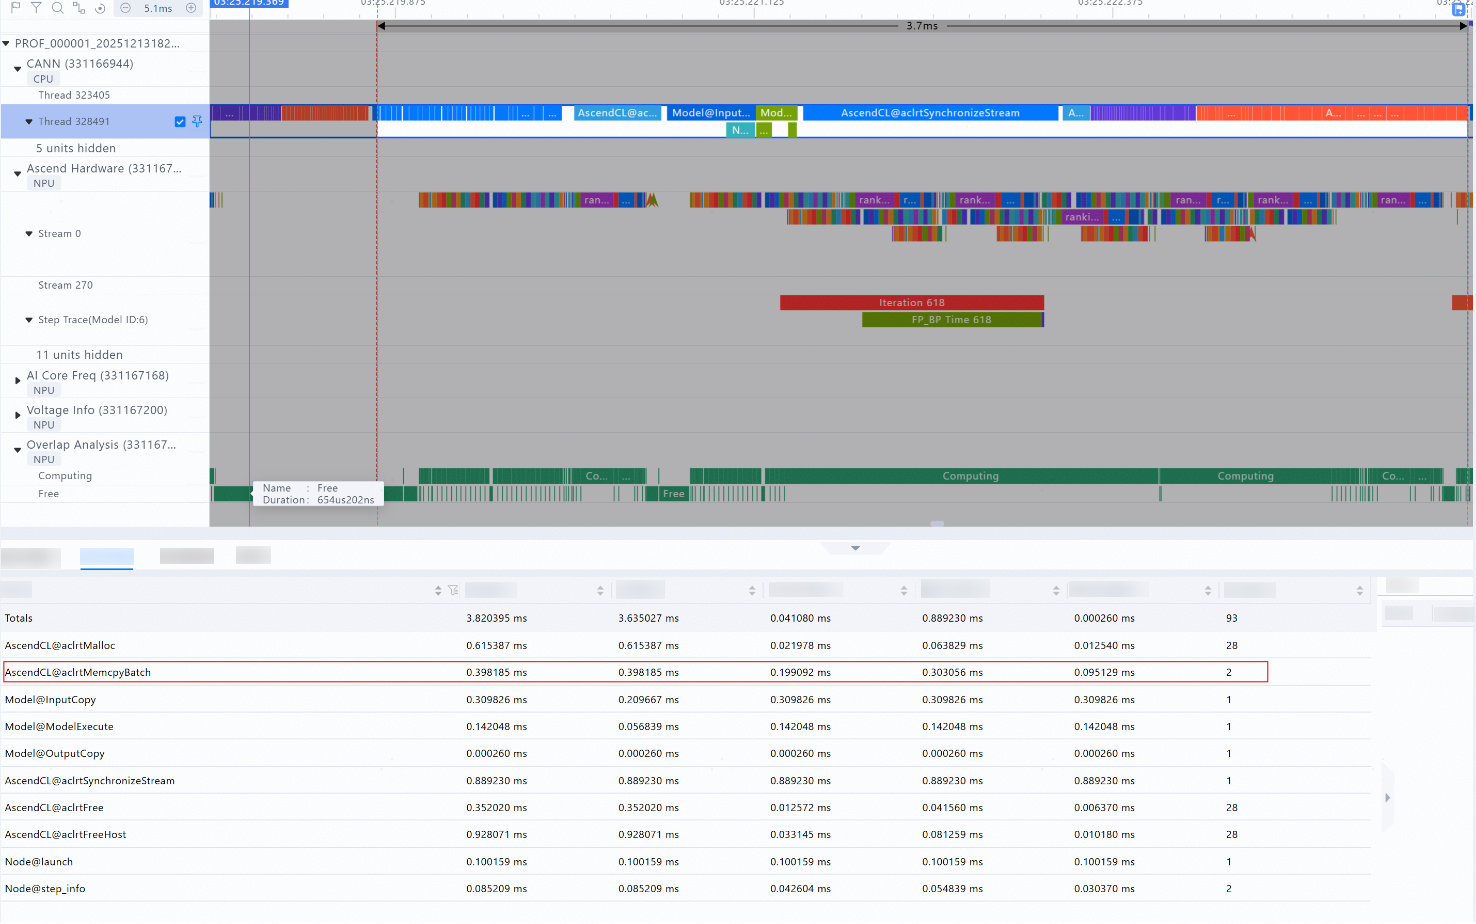
After batch data movement is enabled and multiple data inputs are combined into a single H2D operation, the number of data movements for a single inference is significantly reduced (from 28 to 2) and the proportion of data movement time is reduced (from 53.6% to 10.4%, 0.398185/3.820395). For details, see Figure 4.
- Insufficient kernel granularity and operator scheduling gap
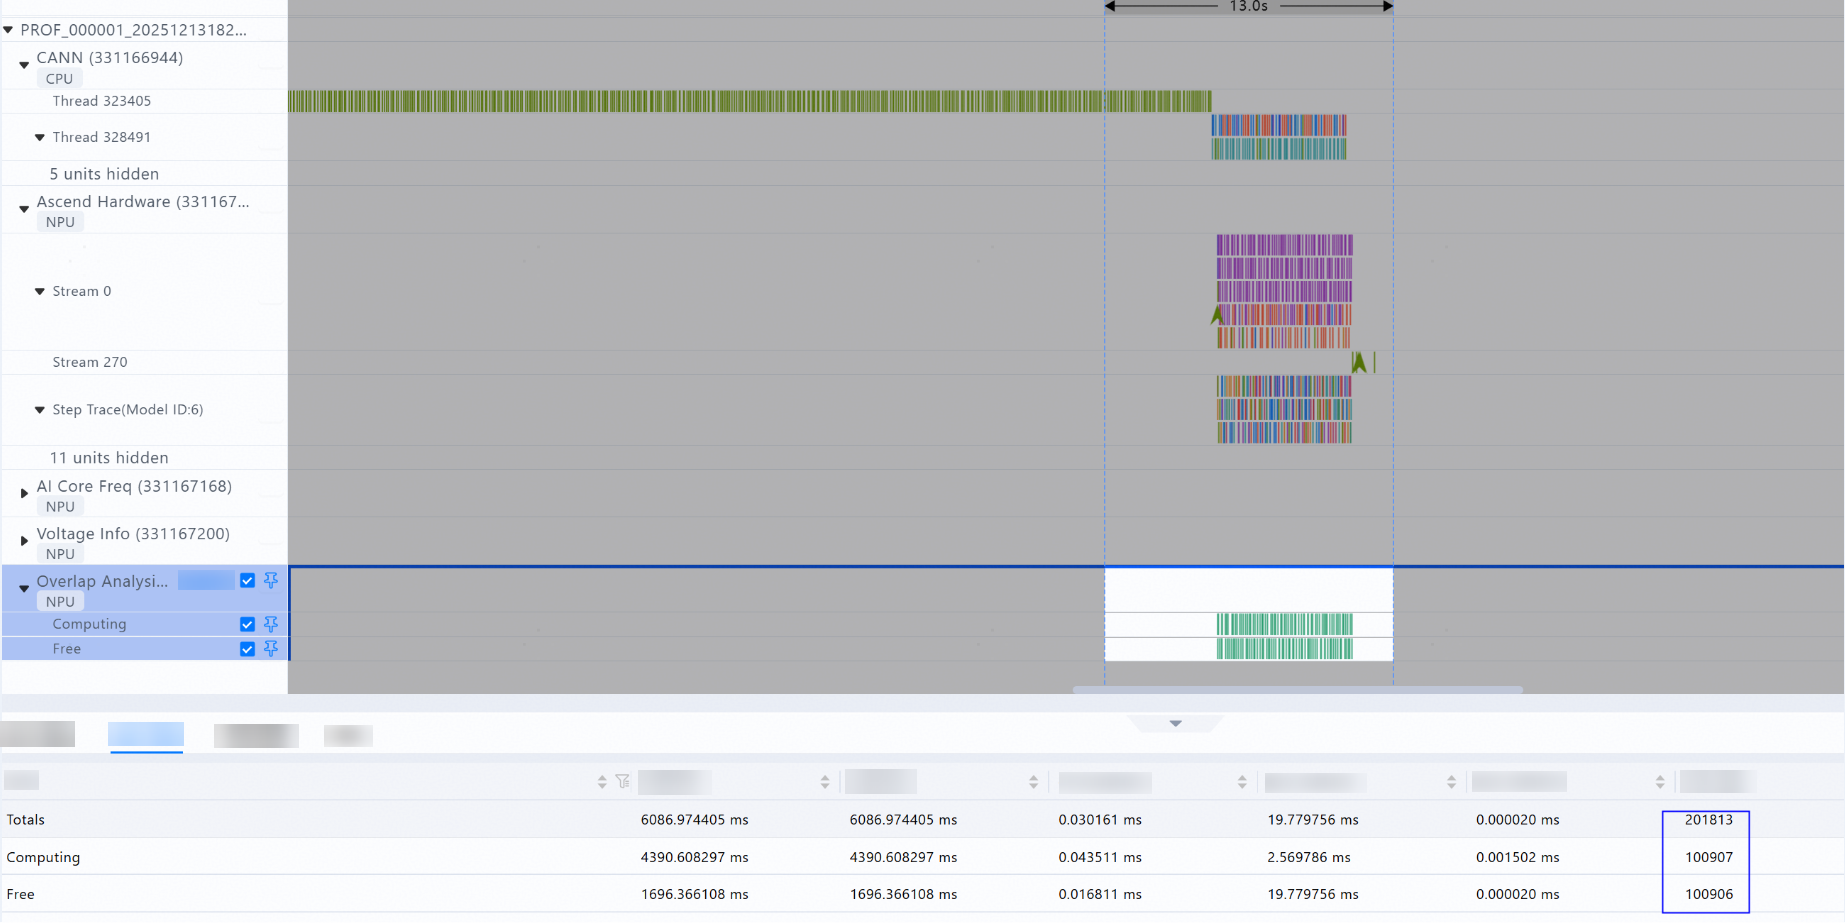
By properly using parallelism and core control, the operator gap can be eliminated. Increasing the batch size improves the operator granularity, increases the scheduling density, and reduces the proportion of scheduling overheads. The number of bubbles is reduced by 81.3% (compared with 539,998 times in Figure 3), and the resource utilization is improved to 72% (Calculation time/Total time = 4390.608297/6086.974405). For details, see Figure 6.
Figure 5 Improved operator granularity by increasing the batch size