您可以按如下步骤定位问题,若无法解决问题,再联系技术支持。您可以获取日志后单击Link联系技术支持。
准备阶段,需收集CANN日志文件。如何CANN日志文件,请参见收集进程卡住问题信息。收集的日志所存放的目录,下文以${HOME}/err_log_info/为例。
- 通过gdb命令观察卡住进程的调用栈信息,同时结合plog运行日志排查框架在线编译算子时间长的问题。
若环境中未安装gdb,则需要安装gdb,可通过包管理(如apt-get install gdb、yum install gdb)进行安装,详细安装步骤及使用方法请参见GDB官方文档。
# 先执行gdb命令,pid表示卡住的用户进程ID,请根据实际情况替换
gdb -p pid
# 再查看调用栈
(gdb)bt
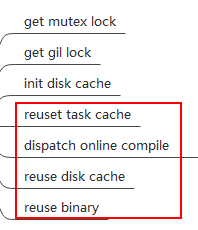
在终端窗口显示的调用栈信息中(可在终端窗口打开查找菜单直接搜索关键字,或者将调用栈信息拷贝到文本文件中再搜索):- 如果栈信息中没有任何CANN内部关键函数,说明任务没有下发到CANN,需定位客户脚本任务下发的问题。
CANN内部函数来源于CANN软件安装目录下的库文件,CANN软件默认安装目录为“usr/local/Ascend”。
- 如果plog运行日志中有“watchdog timeout”关键字,说明可能算子在线编译时间长导致进程卡住,需要联系技术支持进一步定位问题。
plog运行日志(即${HOME}/err_log_info/log/run/plog/plog-pid_*.log日志)示例片段如下:
[INFO][pid:2241703][awatchdog_monitor.c:145](tid:2245407) watchdog timeout, dogId 65584, timeout : 3s
若由于算子编译时长问题导致进程超时退出,或由上层业务框架终止进程,这时可以通过trace日志确认是否存在算子编译时间太长导致进程卡住:
# 在trace日志目录下,查找记录算子编译信息的日志文件
find <trace日志目录> -name "schedule_tracer_FE_Global_Trace.txt"
find <trace日志目录> -name "schedule_tracer_FE_Statistics_Trace.txt"
find <trace日志目录> -name "schedule_tracer_FE_CompileTd_*.txt"
trace日志中的关键字说明:
- schedule_tracer_FE_Global_Trace.txt用于记录算子初始化&销毁、缓存老化等全局性的设置&状态、时间点信息。
该日志中存在“Compile process status.”关键字表示算子在编译中,存在“Finish subgraph compile”关键字表示算子编译结束。若某个算子停留在“Compile process status.”状态,还需要结合schedule_tracer_FE_CompileTd_*.txt日志查看该算子具体处理哪个处理阶段。
日志片段示例如下:
atrace/trace_160081_160353_20240614161350257811/schedule_event_160353_20240614161504656402/schedule_tracer_FE_Global_Trace.txt
2024-06-14 16:13:53.548.098 Begin to initialize TeFusion.
2024-06-14 16:13:53.549.392 Dfx manager has been initialized.
2024-06-14 16:13:58.854.521 CannKb has been initialized.
2024-06-14 16:13:58.890.273 Multi process has been checked.
2024-06-14 16:13:58.892.068 Cache manager has been initialized.
2024-06-14 16:13:59.785.505 TbeCompiler has been initialized.
2024-06-14 16:14:00.399.061 Parallel Compilation has been initialized.
2024-06-14 16:14:00.399.368 PythonApiCall has been initialized.
2024-06-14 16:14:00.400.672 TeFusion has been initialized successfully.
2024-06-14 16:14:38.536.555 Compile process status. ThreadId:139857490806528|Total task cout:1|Finished task cout:1|Waiting task cout:0
2024-06-14 16:14:38.536.718 ThreadId:139857490806528|SingleOp:Assign_2|Task wait second:12
2024-06-14 16:14:38.536.753 Finish subgraph compile. ThreadId:139857490806528|Total task cout:1
2024-06-14 16:15:19.548.089 Compile process status. ThreadId:139857456973568|Total task cout:6|Finished task cout:2|Waiting task cout:4
2024-06-14 16:15:19.548.229 ThreadId:139857456973568|SingleOp:Sub_18|Task wait second:14
2024-06-14 16:15:40.628.425 Compile process status. ThreadId:139857456973568|Total task cout:6|Finished task cout:4|Waiting task cout:2
2024-06-14 16:15:40.628.583 ThreadId:139857456973568|SingleOp:GatherV2_10|Task wait second:6
2024-06-14 16:16:01.959.390 Compile process status. ThreadId:139857456973568|Total task cout:6|Finished task cout:6|Waiting task cout:0
2024-06-14 16:16:01.959.541 ThreadId:139857456973568|SingleOp:Pow_16|Task wait second:7
2024-06-14 16:16:01.959.579 Finish subgraph compile. ThreadId:139857456973568|Total task cout:6
2024-06-14 16:16:32.408.784 Compile process status. ThreadId:139857456973568|Total task cout:2|Finished task cout:2|Waiting task cout:0
2024-06-14 16:16:32.408.943 ThreadId:139857456973568|SingleOp:Pow_2|Task wait second:12
2024-06-14 16:16:32.409.027 Finish subgraph compile. ThreadId:139857456973568|Total task cout:2
2024-06-14 16:16:43.550.284 PreBuildManager has been finalized.
2024-06-14 16:16:43.550.286 Begin to finalize TeFusion.
2024-06-14 16:16:43.559.052 ParallelCompilation has been finalized.
2024-06-14 16:16:43.591.007 Files under kernel meta dir and kernel meta temp dir has been removed.
2024-06-14 16:16:43.808.544 CannKb has been finalized.
2024-06-14 16:16:43.808.737 Python object has been reset.
2024-06-14 16:16:43.823.564 TeFusion has been finalized successfully.
- schedule_tracer_FE_CompileTd_*.txt用于记录当前正在编译的算子状态及变更
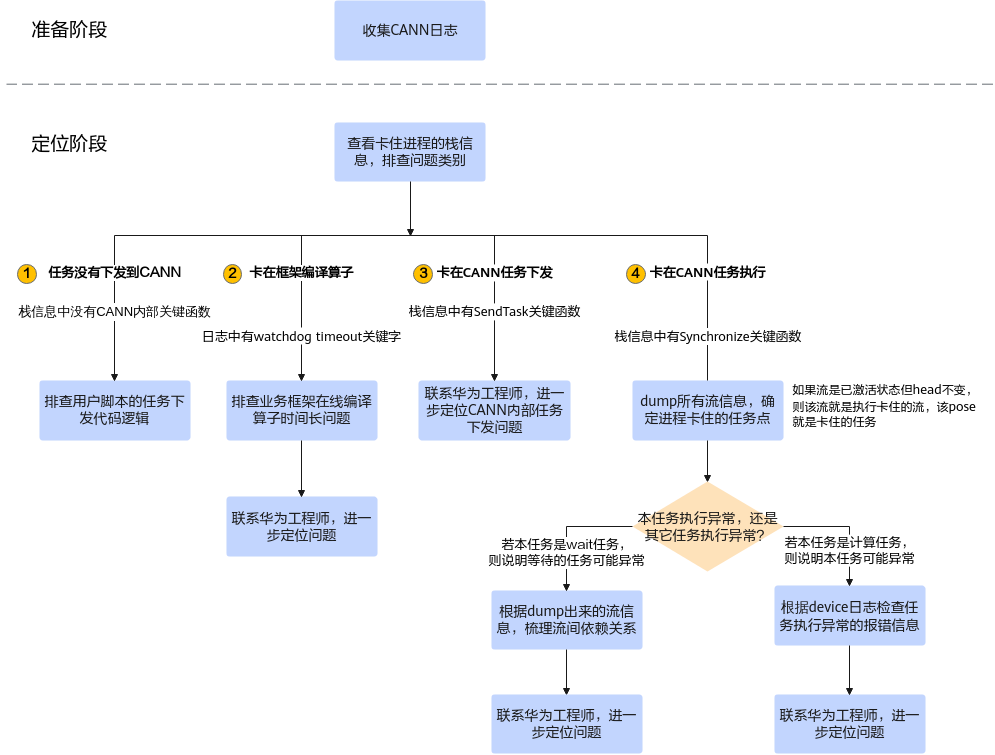
一般来说,若算子的状态停留在“init disk cache”状态,表示算子编译卡住,若进入“reuset task cache”、“dispatch online compile”、“reuse disk cache”、“reuse binary”状态,表明算子编译正常进行中。
日志片段示例:
cat atrace/trace_160081_160353_20240614161350257811/schedule_event_160353_20240614161504666001/schedule_tracer_FE_CompileTd_8.txt
2024-06-14 16:14:35.340.781 Compile process detail:Thread Id:139857456973568|Op Id:10|Op Type:GatherV2|get mutex lock
2024-06-14 16:14:35.340.846 Compile process detail:Thread Id:139857456973568|Op Id:10|Op Type:GatherV2|get gil lock
2024-06-14 16:14:35.340.876 Compile process detail:Thread Id:139857456973568|Op Id:10|Op Type:GatherV2|init disk cache
2024-06-14 16:14:35.346.571 Compile process detail:Thread Id:139857456973568|Op Id:10|Op Type:GatherV2|dispatch online compile
......
2024-06-14 16:15:52.991.561 Compile process detail:Thread Id:139857456973568|Op Id:4|Op Type:Xdivy|get mutex lock
2024-06-14 16:15:52.991.674 Compile process detail:Thread Id:139857456973568|Op Id:4|Op Type:Xdivy|get gil lock
2024-06-14 16:15:52.991.706 Compile process detail:Thread Id:139857456973568|Op Id:4|Op Type:Xdivy|init disk cache
2024-06-14 16:15:52.996.765 Compile process detail:Thread Id:139857456973568|Op Id:4|Op Type:Xdivy|reuse binary
算子编译各阶段的状态一般包括:
- schedule_tracer_FE_Statistics_Trace.txt用于记录整体算子的编译状态,有缓存未使用、更新缓存失败
atrace/trace_160081_160353_20240614161350257811/schedule_event_160353_20240614161504656977/schedule_tracer_FE_Statistics_Trace.txt
2024-06-14 16:16:43.550.032 Disk cache statistics:match times:9|reuse fail times:9|copy times:8|copy success times:7|copy fail times:1
2024-06-14 16:16:43.550.043 Disk cache statistics:cache not existed times:9
2024-06-14 16:16:43.550.044 Online compile statistics:compile task submit times:7
2024-06-14 16:16:43.550.044 Binary reuse statistics:match times:9|reused times:3|reuse fail times:1|reuse check fail times:7
2024-06-14 16:16:43.550.044 Binary reuse statistics:simple key mismatch times:1
- schedule_tracer_FE_Global_Trace.txt用于记录算子初始化&销毁、缓存老化等全局性的设置&状态、时间点信息。
- 如果栈信息中有“SendTask”关键函数,说明卡在CANN任务下发阶段,需联系技术支持定位任务下发代码逻辑问题。
栈信息片段示例如下:

- 如果栈信息中有“Synchronize”关键函数,说明卡在任务执行阶段,需跳转到2继续追溯卡住任务。
栈信息片段示例如下:

- 如果栈信息中没有任何CANN内部关键函数,说明任务没有下发到CANN,需定位客户脚本任务下发的问题。
- 查看日志,找到卡住的流,确定卡住的任务。
- 根据收集的trace日志,查看ERROR报错处的流信息。
trace日志(schedule_tracer_*.txt文件)报错示例如下:
[ERROR] TSCH(-1,null):2024-02-08-01:41:14.977.406 3986 (dieid:0,cpuid:0) stars_timewheel.c:90 stars_wait_sqe_is_timeout: Timeout: sq_pid=80029, sq_id=3, is_need_process=1, exe_time=16, time_out=10, stream_id=3, task_id=47, cur_head=47, wait_sqe_head=47.
[ERROR] TSCH(-1,null):2024-02-08-01:41:14.977.431 3987 (dieid:0,cpuid:0) stars_interrupt.c:1221 stars_proc_wait_timeout: wait task timeout, rtsq_id=3, type=5, sq_pid=80029
- 在trace日志(schedule_tracer_*.txt文件)中根据stream_id查找dump出来的流信息,例如执行grep -rn "stream_id=3"命令搜索关键字。
日志示例及解析如下:
- stream 3的sq_en状态是1,表示流为激活状态;
- head用于标识流上当前正在执行的任务,head的值为47,表示任务索引为47,表示任务执行持续停留在任务47上;
- pos表示具体要执行的任务,由于任务执行持续停留在任务47上,因此pos[47]就是卡住的任务。
################################################################
stream_id=3, rtsq_id=3, sq_fsm=0x9, cur_wait_time=16, head=47, tail=49, is_model=0, model_id=65535, exe_times=65535, sq_en=1, swap_in=0, cq_head=10, cq_tail=10, pid=80029, vf_id=0, is_mc2_sq=0
stream_id=3, overflow_en=0, ge_op_tag=4294967295, has_overflow=0
swapbuff[0] 0x 59080000 0000001f 000d001f 00030201 00000000 0001389d 010007ff 00000000
swapbuff[8] 0x 3e5c8000 00000007 000107ff 00000000 00000000 0000d555 00000052 00000000
sqe[0] 0x 00004003 00278003 0000ffff 00fe0000 00000000 00000000 00000000 00000000
sqe[8] 0x 00000000 00000000 00000000 00000000 00000000 00000000 00000000 00000000
pos=39: stream_id=32771, task_id=39, sqe_type=3, post_p=0
sqe[0] 0x 00010000 00280003 00001000 00fe0000 40400000 00001241 00000000 00000004
sqe[8] 0x c00197c0 00001240 8000a000 00001241 00000000 00000000 00000000 00000000
pos=40: stream_id=3, task_id=40, sqe_type=0, FFTS
sqe[0] 0x 00000004 00290003 00000008 00fe0000 00000000 00000000 00000000 00000000
sqe[8] 0x 00000000 00000000 00000000 00000000 00000000 00000000 00000000 00000000
pos=41: stream_id=3, task_id=41, sqe_type=4, Event Record, event_id=8, isSync=0
sqe[0] 0x 00010000 002a0003 00001000 00fe0000 40400000 00001241 00000000 00000004
sqe[8] 0x c00197c0 00001240 8000a800 00001241 00000000 00000000 00000000 00000000
pos=42: stream_id=3, task_id=42, sqe_type=0, FFTS
sqe[0] 0x 00000005 002b0003 00000009 00ff0000 00000000 0000000a 00000000 00000000
sqe[8] 0x 00000000 00000000 00000000 00000000 00000000 00000000 00000000 00000000
pos=43: stream_id=3, task_id=43, sqe_type=5, Event Wait, event_id=9
sqe[0] 0x 00010000 002c0003 00001000 00fe0000 40400000 00001241 00000000 00000004
sqe[8] 0x c00197c0 00001240 8000b000 00001241 00000000 00000000 00000000 00000000
pos=44: stream_id=3, task_id=44, sqe_type=0, FFTS
sqe[0] 0x 00010000 002d0003 00001000 00fe0000 40400000 00001241 00000000 00000004
sqe[8] 0x c00197c0 00001240 8000b400 00001241 00000000 00000000 00000000 00000000
pos=45: stream_id=3, task_id=45, sqe_type=0, FFTS
sqe[0] 0x 00010000 002e0003 00001000 00fe0000 40400000 00001241 00000000 00000004
sqe[8] 0x c00197c0 00001240 8000b800 00001241 00000000 00000000 00000000 00000000
pos=46: stream_id=3, task_id=46, sqe_type=0, FFTS
sqe[0] 0x 00000005 002f0003 0000000b 00ff0000 00000000 0000000a 00000000 00000000
sqe[8] 0x 00000000 00000000 00000000 00000000 00000000 00000000 00000000 00000000
pos=47: stream_id=3, task_id=47, sqe_type=5, Event Wait, event_id=1
sqe[0] 0x 00004003 00308003 0000ffff 00fe0000 00000000 00000000 00000000 00000000
sqe[8] 0x 00000000 00000000 00000000 00000000 00000000 00000000 00000000 00000000
pos=48: stream_id=32771, task_id=48, sqe_type=3, post_p=0
################################################################
- 排查卡住的原因是本任务执行异常,还是其它任务执行异常导致。
- 如果卡住任务的任务类型是wait任务(日志有Event Wait关键字,同时日志中会打印event_id),则说明该任务是在等待另一个任务的执行结果,另一个任务可能执行异常,需跳转到2.d继续排查;
- 对于非wait任务,任务类型可能为计算任务,则需联系技术支持进一步定位问题。
- 梳理流间依赖关系,排查任务卡住的原因。
在trace日志(schedule_tracer_*.txt文件)中通过event_id,例如执行grep -rn "event_id=1"命令搜索关键字,找到下发Event Record任务的流,该流的record任务没执行,导致另一条流的event wait任务卡住。定位到任务卡住的原因后,需联系技术支持进一步排查软件问题或用户调用逻辑问题。
日志示例及解析如下:通过event_id=1,找到对应的event_record任务所在的stream 2,通过日志中的信息发现stream 2上的任务执行停留在任务0(即pos[0]任务),导致任务卡住,这是因为该流的event_record任务(即pos[1])没有执行,进而导致其它流卡住。

- 根据收集的trace日志,查看ERROR报错处的流信息。