场景解析
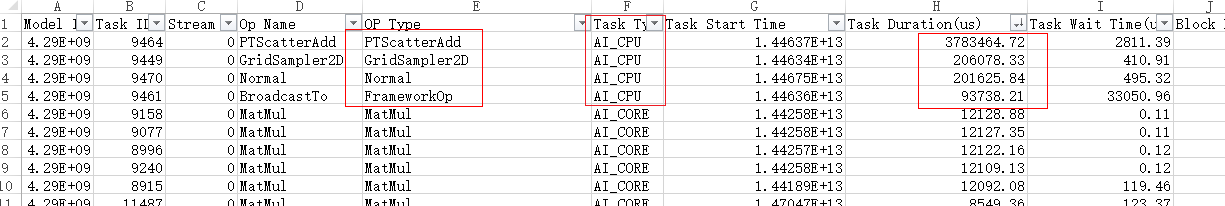
已根据Profiling数据定位出耗时较大的算子,通过构建单算子样例对比GPU与NPU耗时。在OP_SUMMARY算子信息文件中保存了算子的性能数据,其中按照Task Duration耗时排序,可找出耗时算子较大的算子,再进行单算子的耗时分析。
调优思路
从整网中获取Profiling数据,再根据算子数据summary文件,判断出大耗时算子,为其单独构建样例,对比耗时情况,在语义相同的情况下替换算子,从而减少耗时。
优化方法
参考如下样例构建脚本,通过脚本获取算子信息文件。在Chrome浏览器中输入“chrome://tracing”地址,将生成的.prof文件拖到空白处打开,通过键盘上的快捷键(w:放大,s:缩小,a:左移,d:右移)查看算子耗时信息。可参考PyTorch profiling数据采集中的查看profiling数据步骤。
若单个算子耗时明显比GPU耗时长,可参考《AOE工具使用指南》采用AOE工具自动优化,或联系华为工程师进行分析优化。
样例参考
获取算子信息文件的样例脚本如下:
import torch
import torch_npu
import time
import argparse
import os
import torch.nn.functional as F

###### 需自行修改的部分 start ######
# 请自行指定运行方式,通常需要正向和反向
def run(x):
    o = F.softplus(x)
    l = o.mean()
    l.backward()
    return o
# 请自行指定输入shape
shape_list = ([128, 64, 128, 128], [128, 128, 64, 64],
              [128, 256, 64, 64], [128, 256, 32, 32],
              [128, 512, 32, 32], [128, 512, 16, 16],
              [128, 1024, 16, 16], [128, 1024, 8, 8],
              [128, 2048, 8, 8])

###### 需自行修改的部分 end ######

parser = argparse.ArgumentParser(description='PyTorch Prof')
parser.add_argument('--device', type=str, default='cpu',
                    help='set which type of device used. Support cpu, cuda:0(device_id), npu:0(device_id).')
args = parser.parse_args()

if args.device.startswith('cuda'):
    torch.cuda.set_device(args.device)
    prof_kwargs = {'use_cuda': True}
    dtype_list = ['fp16', 'fp32']
elif args.device.startswith('npu'):
    torch.npu.set_device(args.device)
    prof_kwargs = {'use_npu': True}
    dtype_list = ['fp16', 'fp32']
else:
    prof_kwargs = {}
    dtype_list = ['fp32']

if not os.path.exists('./prof_out'):
    os.makedirs('./prof_out')

for dtype in dtype_list:
    for shape in shape_list:
        N, C, H, W = shape
        x = torch.randn(*shape)
        x.requires_grad = True
        x = x.to(args.device)
        if dtype == 'fp16':
            x = x.half()

        run(x)
        with torch.autograd.profiler.profile(**prof_kwargs) as prof:
            run(x)
        prof.export_chrome_trace("./prof_out/softplus_device_%s_dtype_%s_shape_%d_%d_%d_%d.prof" % (
        args.device, dtype, N, C, H, W))  # "output.prof"为输出文件地址


        if args.device.startswith('npu'):
            x.data = x.data.npu_format_cast(3)
            run(x)
            with torch.autograd.profiler.profile(**prof_kwargs) as prof:
                run(x)
            prof.export_chrome_trace("./prof_out/softplus_device_%s_dtype_%s_shape_%d_%d_%d_%d_5HD.prof" % (
                args.device, dtype, N, C, H, W))  # "output.prof"为输出文件地址