Applicable Products

For details about the mapping between AI processors and Ascend products, see Ascend Product Overview.
|
AI Processor Type |
Supported |
|---|---|
|
|
√ |
|
|
√ |
|
|
√ |
|
|
√ |
|
|
√ |
|
|
√ |
|
|
√ |
Timeline report: msprof_*.json.
The following shows a sample msprof_*.json file opened in chrome://tracing.
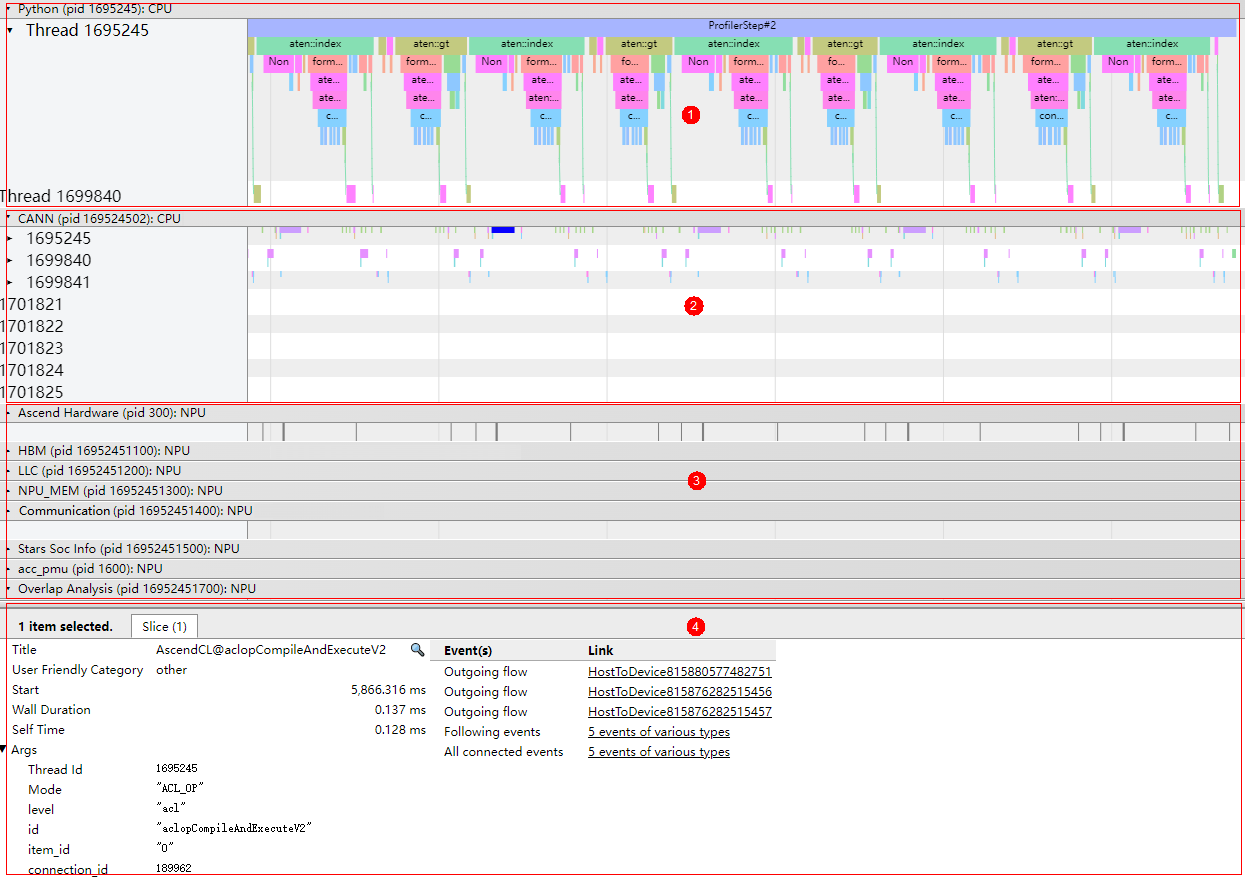
As shown in Figure 1, the timeline summary data is displayed in the following areas:
- Area 1: data at the application layer, including the time consumption information of upper-layer application running. The data needs to be collected only in msproftx or other frameworks.
- Area 2: data at the CANN layer, including the time consumption data of components (such as Runtime) and nodes (operators).
- Area 3: bottom-layer NPU data, including the time consumption data and iteration trace data of each task stream under Ascend Hardware, Communication and Overlap Analysis communication data, and other AI processor system data.
- Area 4: details about each operator and API in a timeline (displayed when you click a timeline).
- Data of the timeline report is described in detail in Profile Data File References.
- The data in each area of the above figure is related to the profiling scenario. Area 1 is generated only when data is profiled in msproftx or other framework scenarios; and Communication and Overlap Analysis communication data can only be profiled in multiple-rank, multi-node, and cluster communication scenarios. Use the actually collected data.
- The msprof_*.json file displays data within iterations. Data outside iterations is not displayed.
Operator Delivery Direction Check
When viewing a .json file in tracing, enable the option under Flow events, and the corresponding delivery and execution mappings between application-layer operators and NPU operators are displayed through connection lines. See Figure 2.
The mappings include:
- async_npu: delivery and execution mapping from application-layer operators to NPU operators on Ascend Hardware.
- MsTx: delivery and execution mapping from traininginference process dotting tasks to NPU dotting operators on Ascend Hardware. This mapping is generated when the aclprofMarkEx API is called for dotting.
- async_task_queue: mapping from enqueuing to dequeuing at the application layer.
- HostToDevice: delivery and execution mapping from CANN-layer nodes (operators) to NPU operators on Ascend Hardware (host to device).
- HostToDevice: delivery and execution mapping from CANN-layer nodes (operators) to communication operators (host to device).
- fwdbwd: mappings from forward APIs to backward APIs.
- Due to the deviation between the AI processor frequency measured by software and the actual frequency, together with time synchronization errors between the host and device, lower-layer operators may lose graph connections due to misalignment.
- Whether mappings between layers are displayed depends on whether the data is collected in a specific scenario.
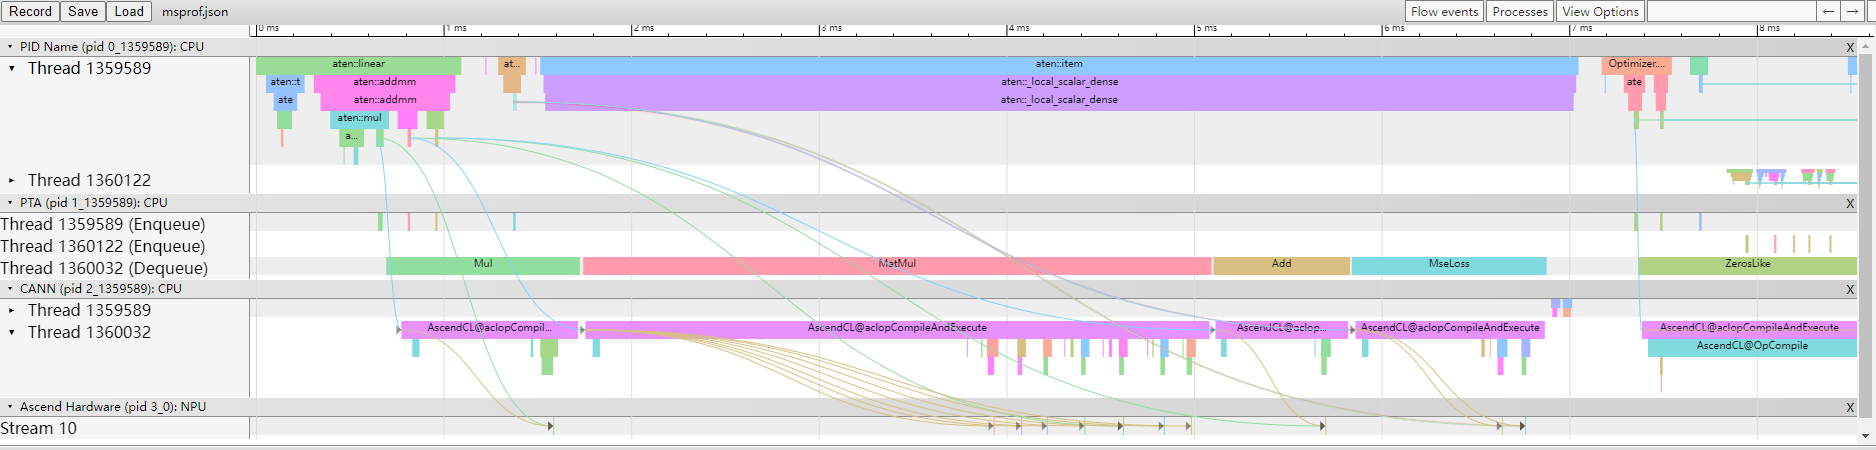
You can click the operator or API at each end of a connection line to view the operator delivery direction. See Figure 3.
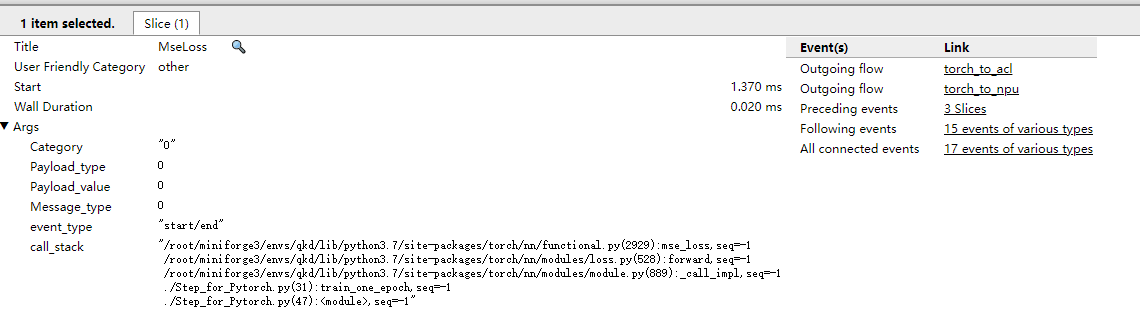
View the inbound and outbound directions of an operator or API in the Event(s) column. View the information at both ends of a mapping in the Link column.
AI Core Frequency Viewing
Applicability:
Atlas 200I/500 A2 inference products Atlas A2 training products /Atlas A2 inference products Atlas A3 training products /Atlas A3 inference products
The AI Core Freq layer in the msprof_*.json file displays the frequency changes of AI Cores during AI task running, as shown in Figure 4.
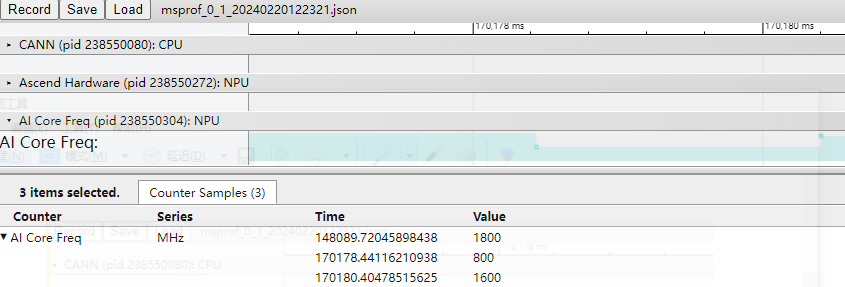
At timestamp 148089.72045898438, the AI Cores were operating at a high frequency; however, at timestamp 170178.44116210938, there was a decrease in frequency which indicates a reduction in performance for AI jobs during that time period. The frequency of AI Cores could be lowered for a couple of reasons. First, as the temperature increases and the built-in protection mechanism is activated, the AI Core frequency may be reduced to prevent overheating. Second, if no AI job is in progress and the AI Cores enter a low-power mode, their frequency could also be lowered.
When frequency changes, there is a delay of 0 ms to 1 ms between the actual frequency change time and the time monitored by the software. This delay may cause the operator execution time before and after frequency change to be inconsistent with the actual time.
SIO Data Analysis
Availability:
- For
Atlas A2 training products /Atlas A2 inference products , the data is 0 and is not for reference. Atlas A3 training products /Atlas A3 inference products Ascend 950PR /Ascend 950DT
The SIO layer in the msprof_*.json file displays the transmission bandwidth between dies.
In
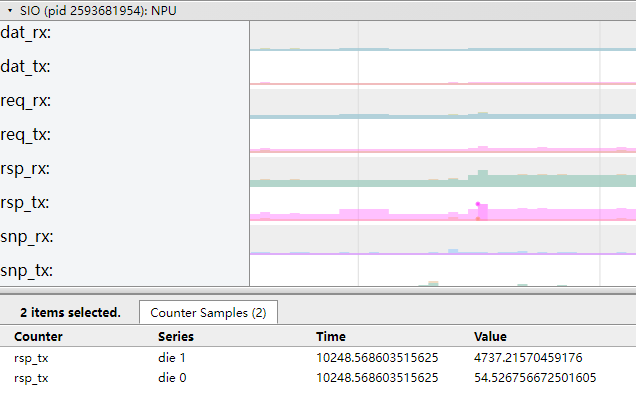
In Atlas 350 Accelerator Card, each SIO data stream uses four physical channels: U-DIE0, U-DIE1, D-DIE0, and D-DIE1. D-DIE indicates Die-to-Die, which means the interconnection between two dies. U-DIE indicates Die-to-Unit, which means the interconnection between a die and a unit. D-DIE0 and D-DIE1 are interconnected and have the same data. Therefore, only one D-DIE needs to be collected. U-DIE0 and U-DIE1 are two dies connected to two units, respectively. Therefore, information about the two U-DIEs needs to be collected separately.
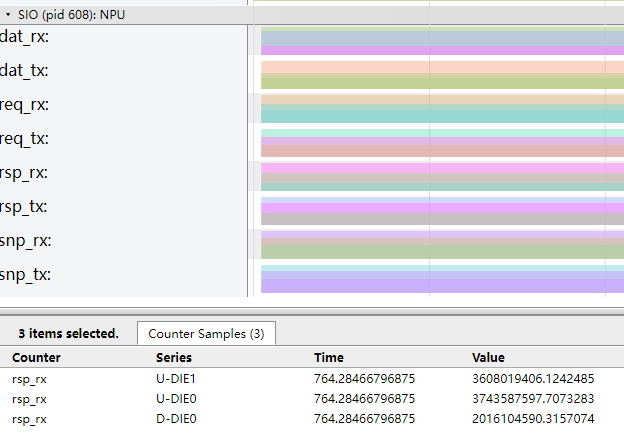
The horizontal coordinate of each color block in the figure corresponds to the time (unit: ms), and the vertical coordinate corresponds to the bandwidth value (unit: MB/s).
|
Field |
Description |
|---|---|
|
dat_rx |
Rx bandwidth of the data stream channel. |
|
dat_tx |
Tx bandwidth of the data stream channel. |
|
req_rx |
Rx bandwidth of the request stream channel. |
|
req_tx |
Tx bandwidth of the request stream channel. |
|
rsp_rx |
Rx bandwidth of the response stream channel. |
|
rsp_tx |
Tx bandwidth of the response stream channel. |
|
snp_rx |
Rx bandwidth of the monitor stream channel. |
|
snp_tx |
Tx bandwidth of the monitor stream channel. |
QoS Data Analysis
The QoS layer in the msprof_*.json file displays the device QoS bandwidth information.
Applicability:
Atlas A2 training products /Atlas A2 inference products Atlas A3 training products /Atlas A3 inference products Ascend 950PR /Ascend 950DT
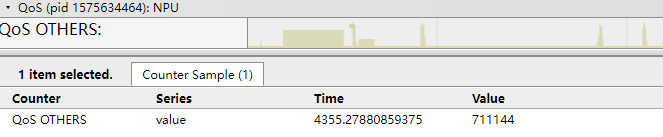
The horizontal coordinate of each color block in the figure corresponds to the time (unit: ms), and the vertical coordinate corresponds to the bandwidth value (unit: MB/s).
Computation and communication operator fusion MC2
Applicability:
Atlas inference products Atlas A2 training products /Atlas A2 inference products
In scenarios where computing and communication operators are integrated.
MC2: Matrix Computation & Communication, a general name of a series of computation and communication fusion operators in CANN. It combines two serial communication and computation operators and divides them into multiple rounds of communication and computation through tiling. The rounds form pipeline parallelism, which masks the communication time and improves the overall execution performance.
Generally, a specific operator is named based on the name of the original computation and communication operator and the dependency. For example, the AllgatherMatmul fusion operator indicates that the communication operator Allgather and the computation operator Matmul are fused, and matmul depends on the Allgather output.
commTurn: number of tiling copies of the fusion operator. Generally, the value is the total data volume divided by the single communication volume.
In the MC2 implementation, two operators are loaded to the computation stream and communication stream, respectively. The two operators collaborate to implement parallel pipeline execution.
- The operator name corresponding to the computation stream is the name of the fusion operator, for example, AllgatherMatmul.
- The operator name corresponding to the stream is in the format of Fusion operator name+Aicpu, for example, AllgatherMatmulAicpu.
The communication operator performs multiple communication rounds based on the tiling of the fusion operator. The basic process of each round is as follows: The communication operator executes the collective communication algorithm based on the communication parameters delivered by the computing operator, orchestrates specific tasks, delivers the tasks to the hardware for execution, waits until the execution is complete, and notifies the computing side of the execution result.
- The MC2 fusion is not supported in the communication API scenario. The communication API scenario includes the MatmulAllReduce operator for low-bit communication and the custom MC2 operator that uses the communication API.
- The communication part of the timeline displays only level-0 data.
The following shows an example of the MC2 profile data result.
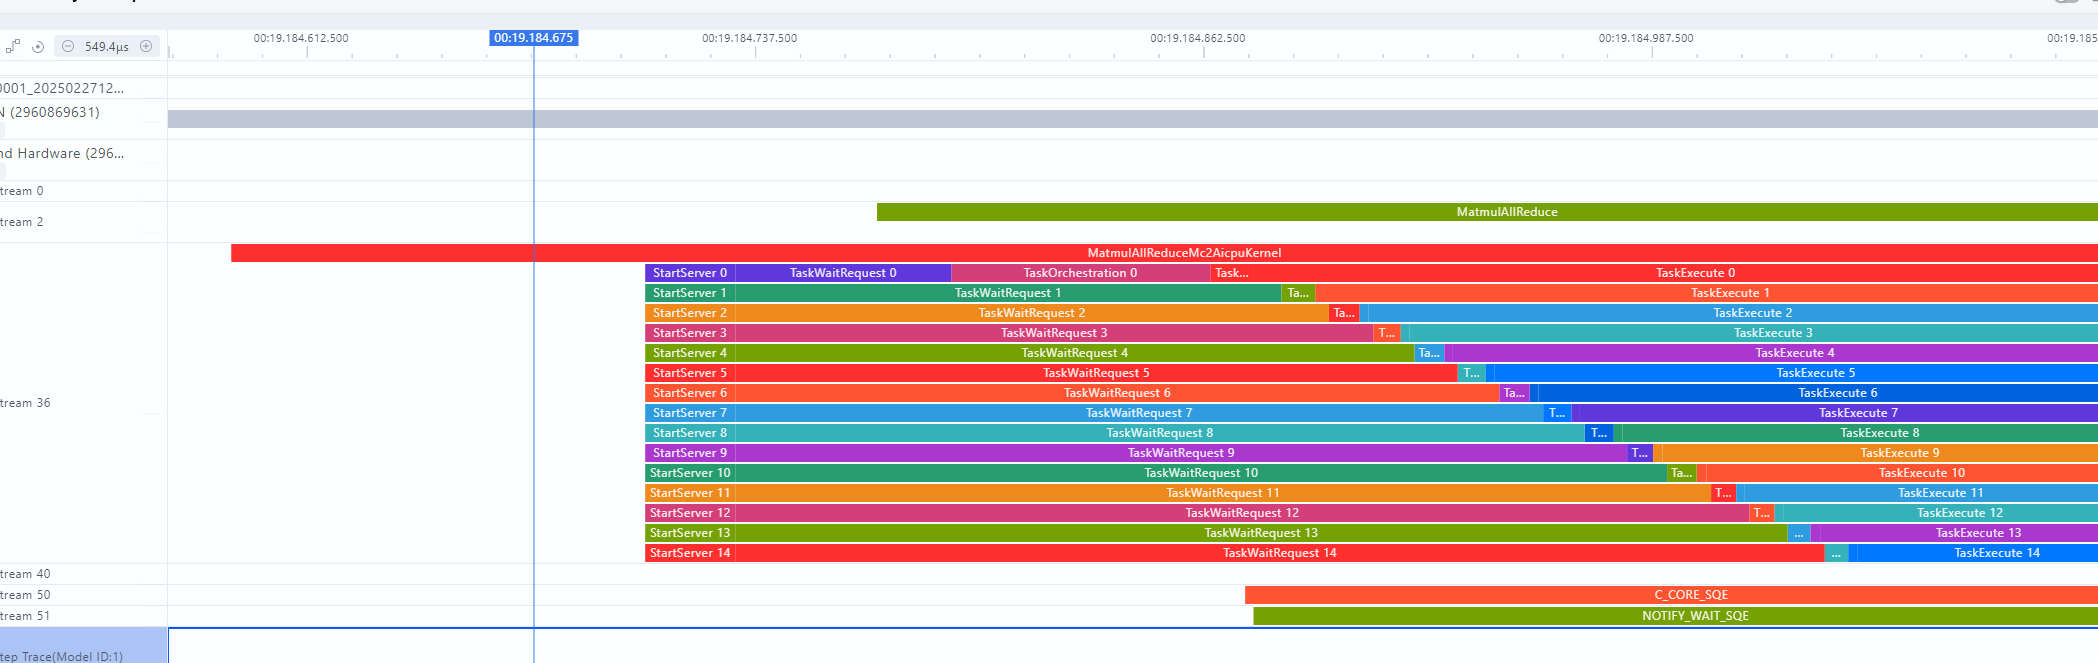
Figure 8 shows the MatmulAllReduceAddRmsNormAicpu fusion operator. For details about each stage, see Table 2.
|
Field |
Description |
|---|---|
|
StartServer |
KFC initialization time. |
|
TaskWaitRequest |
Wait for the computation operator to deliver communication parameters. |
|
TaskOrchestration |
The communication operator executes the collective communication algorithm and orchestrates and executes tasks. |
|
TaskLaunch |
Time required for issuing tasks. |
|
TaskExecute |
Time of waiting for the completion of a hardware task. |
|
Finalize |
KFC end process. |
Voltage Data Analysis
Voltage Info in msprof*.json displays the device voltage transformation information.
Applicability:
Atlas A2 training products /Atlas A2 inference products Atlas A3 training products /Atlas A3 inference products
The following example shows the voltage transformation characteristic curve.

Figure 9 shows the voltage transformation characteristic curve. In the figure, the horizontal coordinates of the color blocks correspond to time (ms), and the vertical coordinates correspond to voltage values (mV). Table 3 describes the fields.
Ascend Hardware-level Profiling Gap
Applicability:
Atlas A2 training products /Atlas A2 inference products Atlas A3 training products /Atlas A3 inference products Ascend 950PR /Ascend 950DT
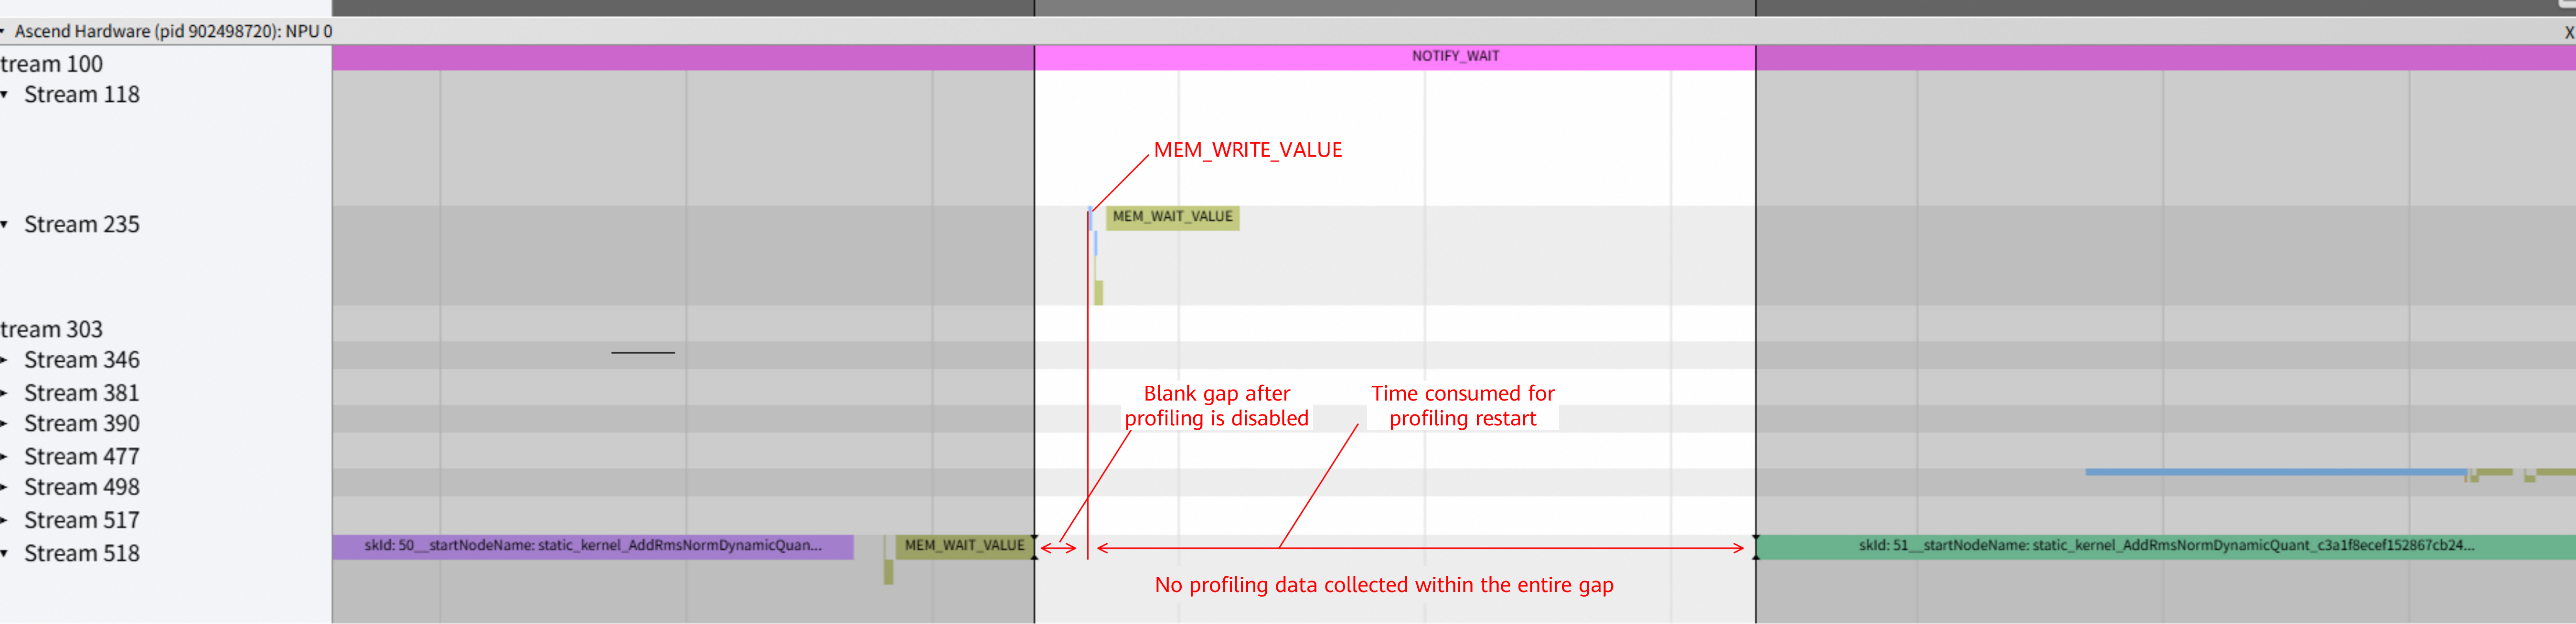
As shown in the preceding figure, at the Ascend Hardware level, blank gaps appear in subsequent timelines when MEM_WAIT_VALUE or CAPTURE_WAIT occurs. These gaps cover two types of events:
- First, profiling is automatically disabled to reduce the volume of profile data collected. During this period, MEM_WAIT_VALUE or CAPTURE_WAIT is repeatedly executed, so only the first few records are retained.
- Second, the period from the occurrence of MEM_WRITE_VALUE or CAPTURE_RECORD to the resumption of normal operator data profiling represents the time spent on restarting profiling. This gap has no performance analysis significance and does not exist during normal execution when profiling is disabled.